Sunday, June 30, 2013

Where Is Life Better?

Real GDP per capita gets criticized as a measure of well-being. Here’s a more comprehensive measure:

These rankings were produced on the basis of a certain weighting of factors. If you don’t like the weights, you can change them to ones you prefer.

What’s cool about the version shown above, lifted from The Economist, is that it allows you to compare the top and bottom of each country.

So, yes, the rich live best in the U.S. And yes, inequality (the distance between the blue and orange circle) is greater in the U.S. than in most other countries. But on the other hand, the poor live very well in the U.S.: as well as the rich in Italy, and better than the rich in Israel, Russia, Portugal, Brazil, Turkey and Mexico.

Now, you should ask the Rawlsian question: where is the place where the poor are the best off. Canada, Sweden and Australia have us beat on that count.

Saturday, June 29, 2013

Exchange Rate Inequities

John Cochrane:

If they don't like the Chinese peg, maybe next they can target Texas for its 1-1 peg to the Ohio dollar, which is obviously sucking business to Texas.

It’s hard to get the point across to undergraduates that living inside a country is like living in a big fixed exchange system. And fixed exchange systems, by construction, allow the free transfer of wealth from one location to another.

Alternatively: people who bitch about Texas are just avoiding the inadequacy of their own current location.

Via Café Hayek.

Immigrants Don’t “Take” Jobs Away

John Cochrane:

The vague charge that immigrants will “take jobs” and lower American’s wages is not established at all in economics, and it doesn’t make much sense anyway.  … Our ancestors didn’t steal Native Americans’ jobs to get rich;

The Landsburg Multiplier

Steven Landsburg argues that if the Keynesian story of the mulitplier is true, then there’s also a (huge) multiplier on his own personal spending. Your’s too. Here’s the Keynesian story. We start with:

Y = C + I + G

Next, we notice that people tend to spend, oh, say about 80 percent of their incomes. What they spend is equal to the value of what ends up in their households, which we’ve already called C. So we have

C = .8Y

Now we use a little algebra to combine our two equations and quickly derive a new equation:

Y = 5(I+G)

That 5 is the famous Keynesian multiplier.

To see how what story perverts the math, try this:

Let’s start with this one:

Y = L + E

Here Y is economy-wide income, L is Landsburg’s income, and E is everyone else’s income. No disputing that one.

Next we observe that everyone else’s share of the income tends to be about 99.999999% of the total. In symbols, we have:

E = .99999999 Y

Combine these two equations, do your algebra, and voila:

Y = 100,000,000 L

That 100,000,000 there is the soon-to-be-famous “Landsburg multiplier”. Our equation proves that if you send Landsburg a dollar, you’ll generate $100,000,000 worth of income for everyone else.

The argument was originally made by Murray Rothbard.

How Much Does Regulation Knock Off of Growth?

New research by Dawson and Seater indicates that the amount is huge.

They estimate that the real GDP growth rate was reduced by 2% per year.

Compounding since World War II, they estimate that per capital real GDP in the U.S. is over 70% lower than it would be otherwise.

How do you feel that you should expect to be graduating and finding a first (real) job at $30K/yr instead of $100K/yr?

Our Trading Partners

Just a graphic with some macro trivia:

How little does the US trade with Africa? Very little.

Via I Love Charts.

Thursday, June 27, 2013

What Are the Options to Make Social Security Sound?

Here’s an interactive tool from the Committee for a Responsible Federal Budget.

Do note that the first page only contains the big movers. The smaller ones are all under the “Other Benefits” tab.

Note the huge benefit from moving to cost-of-living-adjustments based on CPI minus 1%. This does nothing to improve the calculation of the CPI (as the chaining finally promoted by President Obama this past spring). But, it does make a rough move to correct for the fact that the CPI, as a Laspeyres index, systematically overstates the rate of inflation. Whether the 1% is too much or too little is open to debate, but this can take care of a huge chunk of the problem right off the bat.

Also note that the bugbears of reducing fraud and waste (a Democratic favorite) and going after disability (a Republican favorite) are really minor players. The huge focus on these in the political arena and legacy media should be your first clue that those people are more serious about name-calling and scoring easy political points than actually addressing the problem.

Lastly, in politics, it’s often easier to get a small package of more unpopular things that hurt everyone done, than to nitpick over a large basket of things that individually don’t hurt that much. According to this tool, we can solve the entire problem by switching to CPI minus 1%, and raising the retirement age to 69 and then indexing it to grow with longevity.

Tuesday, June 18, 2013

Cyprus Update: Capital Controls Aren’t Stopping Capital Flight

It’s been 3 months since the Cypriot crisis was “solved” with capital controls.

Those controls were intended to keep capital (movable, fungible wealth) from leaving the country. A country needs capital for investment and economic growth, but who would want to keep capital in a place where the government can tax it away to cover the mistakes of others? So, when you’re like Cyprus, capital leaves the country. Capital controls are supposed to limit that.

Now … we don’t have a counterfactual: we know what the data says happened with the controls in place, but we don’t know how much worse (or possibly better) things would have been without them.

Anyway, the data isn’t pretty. Twice as much capital left Cyprus in April (after the controls were put in place) than in March (when the country basically was shut down).

Cyprus’ overall problem is roughly in the (low to mid) tens of billions of dollars.

And with capital controls they still lost $3B in a month.

Which money left? About half was foreign, and about half was Cypriot. It’s not good when your own natives are taking their wealth out of their own country.

And surprisingly, a lot of the money that left was already denominated in dollars. That is money that is held in a Cypriot branch of an institution that operates in the U.S. That money should have been safe already, since it kinda’ sorta’ is already non-Cypriot. But it moved too, probably to American financial institutions without operations in Cyprus at all. This is what you do if 1) your long-run goal is to “get the heck out of Dodge”, or 2) you are selling your wealth to family and friends in foreign countries in exchange for basic products that they are shipping to you (in short, you can’t get stuff like, say, printer toner because you don’t have any cash to buy merchandise, and the stores don’t have any money to buy inventory).

Via Marginal Revolution.

Thursday, June 13, 2013

You Heard It Here First

Back in March, when I first heard about it, I posted about the new research from Paul Beaudry, David Green and Benjamin Sand. I was taking a shot that theirs’ is the sort of result that ends up in undergraduate textbooks in 5 or 10 years.

I think I’m on the right track, since the article has now been mentioned in the cover story to the Mary 13-19 issue of Bloomberg Businessweek. That’s not an outlet for serious academic research unless it’s really provocative.

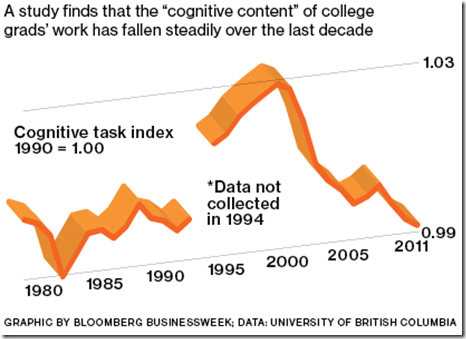
The researchers found that the average “cognitive content” of tasks performed by employed college graduates of all ages peaked in 2000 and has dropped fairly steadily since. … In the same vein, the Conference Board, a company-supported research organization, recently found that since 2000 the importance of math and science skills in jobs declined, while social skills became more important.

This is one of those horrifyingly-difficult-to-read-correctly charts that the legacy media specializes in. Cognitive content is the name given in Beaudry et al. for the amount of technical knowledge a job takes; jobs high in cognitive content include management executives, professionals, and skilled technicians. The graph is for the current job of recent graduates. So it says that the amount of technical knowledge required peaked around 2000, and has declined to the level from the 1980’s.

In short, the economy needed lots of technically skilled people in the 90’s, and since you can’t retrain very many people in mid-career, that gap was filled by college graduates But now that those people are in mid-career, the economy doesn’t need as many technically skilled young people.

What isn’t shown on the graph is the Beaudry et al. argue that schools are still producing lots of technically skilled graduates, and that’s no longer where the jobs are.

The result is that technically skilled graduates are going into jobs that don’t require all the technical background (e.g. barista), and pushing the people with lower skills out of those jobs.

There’s a set of Powerpoint slides in PDF format here. The penultimate slide shows that new graduates at the top end of the income distribution got big gains in the 1990’s, consistent with there being a big benefit to being highly skilled. But that same group has done just as well (or poorly) as any other group since 2000, consistent with the excess demand for skills dissipating.

Tuesday, June 11, 2013

Why Is Macroeconomics So Hard: The WTF, Lying, Deceptive, Senator Edition

A scholar from a conservative think tank is called a liar, for 8 minutes, on national television, by a Democratic Senator.

The scholar had the temerity to cite what European governments did do in the most recent data.

The Senator said this was a lie, and produced a deceptive document in support. The Senator’s document showed the European government’s plan for what they plan to do.

That’s right: plans are facts, and facts are lies. You can’t make this stuff up.

The specifics are about fiscal policy. It’s a common position that European governments are pursuing contractionary fiscal policies, and that this isn’t a good idea when their economies are down. The scholar produced evidence that government spending was up rather than down, and thus presumably expansionary. The Senator produced evidence that the governments planned to cut spending in the future, and that this was somehow contractionary today. Sheesh.

Via seminal new Keynesian Greg Mankiw (now pilloried as a conservative) and Steve Landsberg who covered this in full, and said:

… Only sheer dishonesty — or perhaps an extraordinary failure of competence — can account for a discrepancy like this.

Can We Eliminate Subsistence Level Absolute Poverty In the Next 20 Years?

The Economist thinks we’ll get pretty close:

Keep in mind, that while we complain about poverty in the U.S., it is relative rather than absolute poverty. There hasn’t really been any significant population within the U.S. living at the subsistence level in a century.