GDP has always been flawed. It’s missing home production, and underground production, and leisure, and the flow of environmental services.
But, our hope has always been that what it’s missing is roughly in proportion to what it measures. If this is true, then GDP is still a good measure of overall value.
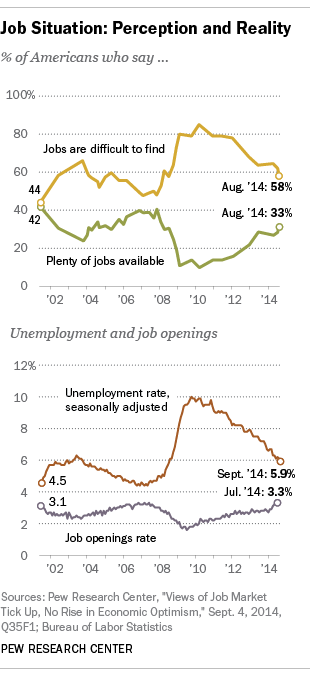
Except for consumer surplus. GDP has always missed consumer surplus, And this didn’t seem to matter much … until the internet started turning lots of measurable GDP into not-so-measurable consumer surplus.
Think about a music file that you obtain for something less than its retail price. The value to you is the same, but almost all of that value is now surplus instead of revenue for the music industry. This means GDP actually falls when you pirate a song.
And yet the well-being that GDP is supposed to measure actually goes up when society pirates songs. The reason is that as price falls, we move down along the demand curve. Yes, we’re reducing measurable revenue to the industry, but we’re increasing the triangle of consumer surplus in two dimensions: both the price we would pay but no longer do, and the number of people who find it in their interest to obtain and enjoy the song at the lower price.
N.B. I do recognize that there is a broken window fallacy that’s also involved with pirating music, but that’s not my concern here.
Anyway, I think I’ve got you convinced that there’s something new going on with consumer surplus. Now consider this video. This is a serious short film, and I’m sure the creators thought nothing of what it says for macroeconomics.
ASPIRATIONAL from Matthew Frost on Vimeo.
Did the two girls get something of value? Yes, I think it’s obvious they did. Does it enter into GDP? Of course not. That’s problem one.
But there’s a second bigger problem. How did they produce that value?
Hmmm. Let’s play macroeconomist. The girls combined labor, capital and technology to create value. What’s the labor? I suppose it’s the girls’ time (posing, clicking, tagging, texting, and harvesting the enjoyment that follows) and the time Kirsten Dunst is actually being photographed.* But what about the rest? The phones and the internet are capital. Now, there’s technology involved in both of those too, but it’s sort of boring for my purposes because it’s extant technology.
But what about Kirsten Dunst? Is there more to her than labor? If so, is she capital or technology? I think she’s a little bit of both, perhaps even quite a bit of both, since she’s a lot more important to producing this bit of value than anything else.
She’s definitely capital in that she’s productive, and her productivity will depreciate if not cared for. A name will help with this idea; how about “Dunstware”. I think it is fair to say that an actress like this would be very concerned about the potentially rapid depreciation of her Dunstware.
But she’s also technology: a productive, non-rivalrous idea, that can be used repeatedly without being consumed. Call this “Dunstfulness”. This picks up the idea that you’re never going to be in a photo with Kirsten Dunst unless she brings her Dunstfulness with her; photoshopping is still possible, but then it’s really a form of technological spillover in which someone can use Dunstfulness without necessarily having permission to do so.
That’s mind blowing. Could you, just a few minutes ago, have conceived of a person’s … personness … as a form of technology?†
It’s get’s better. Dunstfulness is a technology for which there are network externalities that aren’t even based on production. Consider a theorem. Yes, it has network externalities because it can be used repeatedly to create new value. Dunstfulness is better than that: she can repeatedly create value (in the girls’ friends) without be used at all.
So, Dunstfulness is a technology that should be measured with our national wealth. And, it’s capable of helping to produce something valuable that should be measured in our GDP.
Further, our GDP, which does measure all the production values that go into creating Dunstware, and is clearly not going to measure the long-term investment made in creating Dunstfulness. And yet, no doubt, a lot of people along the line involved in that no doubt envisioned their work as an investment in Dunstware or Dunstfulness.
Whoa.
* Can we even use the word “photographed” for what happens in the video?
† Yes, I had to use a website that collects suffixes to come up with these names.


