Tuesday, January 13, 2015

Labor Market Asymmetry In Charts

Business cycles aren’t symmetric: expansions are longer than contractions, troughs are sharper than peaks (yes, the names we use are kind of backwards there), and so on.

Labor market behavior associated with business cycles is even more asymmetric. This is shown in this panel of 3 charts:

Note in each case how quickly each of these (negative) aspects of the job market peaks, and how gradual the improvement is afterwards.

This behavior is typical. I remark in this class each semester what a colossal blunder it was for the Obama White House team to suggest, fairly constantly in the early part of their tenure, that they’d be able to fix the economy quickly. Any macroeconomist would know that’s nonsense because charts like those above are common to all recessions; I’m speculating that the claim they could defy historical regularities like this was made by politicians, bureaucrats, or marketers … but not by economists.

The same article contains another chart about another feature of measuring unemployment (but not one showing asymmetry). Over the last several years, you may have heard people say something like actual unemployment was, say, 6%, but “real” unemployment was much higher than that. This is another inane claim that a macroeconomist just would not make, but a politician, bureaucrat or journalist just might. The chart on the left shows this:

15-01-13 WSJ Capture of Unemployment Rates

So the beige series in the chart on the left is produced by counting the people from the three groups in the top chart in a broader measure of unemployment.

The problem with this broader rate is not that it’s uninteresting or uninformative. Instead, the problem is that it doesn’t add much to what’s contained in the announced unemployment rate: it’s kind’of like adding 6% to it each month. Big deal. Macroeconomists don’t focus too much on those alternative measures of unemployment because they’re so highly correlated with the narrower measure. Highly correlated translates into a colloquial “not much new to see”.

It’s cynical, but people in the media like having a more broadly defined unemployment rate (that looks worse) because it gives them another hook to present bad news. And bad news sells advertising, because humans have this jerky interest in bad things that happen to other people. The Germans even have a word for it: schadenfreude.

Read the whole thing, entitled “Hiring Booms, But Soft Wages Linger” in the January 9 issue of The Wall Street Journal.

Revisiting Haiti

I periodically revisit old issues posted on this blog.

Haiti is the poorest country in the western hemisphere. Five years ago this week, Haiti was hit by an earthquake.

The magnitude of this quake was comparable to the one that hit San Francisco during a World Series game in 1989. The 40 to 1 difference in per capita real GDP between the United States and Haiti translated into a 1000 to 1 difference in earthquake deaths.

Chile was hit by a much larger earthquake around the same time as Haiti. There are some mitigating reasons, but Chile is a lot more developed than Haiti, and the there were 300 times more deaths in Haiti than in Chile.

Lots of people reflexively blame problems in places like Haiti on exploitation by the rich. If anything, the exploitation seems to be going the other way.

And Haiti’s problems are not for lack of help. Consider David Brooks’ second argument from this article.

Why revisit this now? Because Congress is looking into where all the aid money for Haiti actually ended up. Their former ambassador to the U.S. alleges that most of it did not end up helping Haitians very much.

Sunday, January 11, 2015

Further Left

We’re not going to discuss this area in my class, but for curiosity and exposure purposes I want you folks to be aware that there are arguments and politicians who are currently active and to the left of the mainstream of the Democratic party.

The politician is Senator Bernie Sanders (VT), who may run for President … as a Democrat … or a Socialist … or something.

He’s chosen as his top economic advisor an advocate of what’s called Modern Monetary Theory (MMT). Her name is Stephanie Kelton; she doesn’t have a dedicated page at Google Scholar, but here’s the results of a search.

For your purposes, in the contemporary environment, MMT advocates focus much less on the negative effects of government borrowing, and much more on government spending. Essentially, it’s like Keynesian macroeconomics with an assumption that the economy is pretty much never at full employment. In this longer exposé on the policy implications of the theory from the Washington Post, one of the proponents argues that we haven’t been at full employment in a century.

If pressed, I’m dismissive of this whole viewpoint. Having said that, we need to recognize that we don’t have experimental data on this. It would be nice if some country would go out, assert they’re going to follow this practice, and then do so … and then we could all look at the data 20 years later. But that never happens. Without that, I’m kind of left with the fudge of saying that … hmmm … to me it kinda’ sorta’ looks like this is the policy followed by an Argentina or a Greece. That’s not good, but like I said, I tend to be dismissive of these folks.

Sunday, January 4, 2015

John Cochrane on Russia and the Ruble

John Cochrane is a University of Chicago business school professor who works on the borderline between macro and finance.

He’s posted a long piece on the evolving situation in Russia. Read the whole thing.

This is an interesting event on which to test out our various frameworks for thinking about macroeconomics and monetary economics.
Theories
There are three basic perspectives on exchange rates.
1. Multiple equilibria. Lots of words are used here, "speculative attacks," "sudden stops," "hot money," "self-confirming equilibria" "self-fulfilling prophecies" "contagion" and so on. Basically, the exchange rate can go up or down on the whims of traders. There is often some news sparking or coordinating the bust.  Some of the mechanism is like bank runs, pointing to "illiquidity" rather than "insolvency" as the basic problem.
This has been a dominant paradigm since the early 1990s. I've been a bit suspicious both on the nebulousness of the economics (lots of buzzwords are always a bad sign), and since the analysis seems a bit reverse engineered to justify capital controls, currency controls, (i.e. expropriation of middle-class savers and poor currency-holders), IMF rescues, and lots of nannying by self-important institutions and their advisers who will monitor "imbalances," "control" who can buy or sell what, and so forth. But models are models and facts are facts.
2. Monetary. Exchange rates come from monetary events, and primarily the actions of central banks. For example, much of the analysis of the dollar strengthening relative to euro and yen attributes it to the idea that the US Fed has stopped QE and will soon raise rates, while the ECB and Japan seem about to start QE and keep rates low.
3. Fiscal theory. Exchange rates come fundamentally from expectations of future fiscal balance of governments; whether the governments will be able and willing to pay off their debts. If people see inflation or default coming, they bail out of the currency, which sends the price of the currency down. Inflation follows; immediately in the price of traded goods, more slowly in others.

I tend to fall in the camp with # 3: exchange rate movements tell us about how people feel about one government’s credibility versus other governments.

Russia’s problems are coming from three sources: oil prices, international concerns about their behavior towards Ukraine, and kleptocracy related to the Sochi Olympics.

Oil price drops are a problem because, unlike developed “Western” nations, most poorer countries government’s own their oil reserves. So the fiscal position of the government depends critically on maintaining high prices. You may have also noticed that a lot of government officials are economically … pretty dumb. It doesn’t have to be this way, but typically governments get into trouble by locking in expensive spending plans when oil prices are high that they can’t unwind when the prices fall.

The situation with The Ukraine is a mess (and the Ukrainians aren’t entirely innocent). What’s important for a macro class a year later is that economic sanctions were put in place on Russia. Now Russia is trying to be a richer more developed country without the thick financial markets that richer developed countries … hmmm … develop as they go through the process of getting richer. So basically, they borrow a lot from foreigners, and repay those loans by borrowing even more. This has been cut off. Keep an eye on any weakening of the sanctions: this probably means that financial interests here are putting pressure on politicians here because Russians over there are threatening default. On the other hand, those same discussions of weakening sanctions are also pretty good evidence that they’re working.

Sochi: the most expensive Olympics ever, put on by an underdeveloped country, in a sub-tropical climate. Sheesh. There’s a ton of evidence that this was a big corruption event: Russia used government budgets to overpay for stuff sold to them by top supporters of the Russian government. Basically, it was money laundering. You can imagine that most of that money ended up in Cyprus, and Switzerland, and London, and even places like Park City.

Interestingly, a few weeks ago I speculated that Russia’s foreign reserves had been looted. Cochrane implies the same thing:

Russia ran big trade surpluses, meaning there are foreign assets somewhere. But those may have all ended up as Russian owned London apartments and Swiss banks and not available to Russian banks and businesses.

The last time I wrote about Russia 3 weeks back, I was unaware of the Rosneft switcheroo. Cochrane explains by quoting The New York Times coverage:

Rosneft, for example, had been clamoring for months for a government bailout to refinance debt the company ran up while making acquisitions when oil prices were high. Because of sanctions, those loans cannot be rolled over with Western banks. Debt payments are coming due later this month.
... With the oil giant in a bind, the central bank ruled that it would accept Rosneft bonds held by commercial banks as collateral for loans.
Rosneft issued 625 billion rubles about $10.9 billion at the exchange rate at the time, in new bonds on Friday. The identities of the buyers were not publicly disclosed, but analysts say that large state banks bought the issue.
When these banks deposit the bonds with the central bank in exchange for loans, Rosneft will have been financed, in effect, with an emission of rubles from the central bank. The deal roiled the ruble on Monday, according to analysts.
The reason for Monday’s currency crash is “well known,” Boris Y. Nemtsov, a former deputy prime minister who is now in the political opposition, wrote on his Facebook page. “The central bank started the printing press to help the Sechin-Putin business, and gave Rosneft 625 billion newly printed rubles. The money immediately appeared on the currency market, and the rate collapsed.”

Oops. One thing you need to recognize about government officials in a crisis is that they’re control freaks. And they think they can pull this stuff off without anyone noticing. When there’s a lot of money on the line, that doesn’t work out so well.

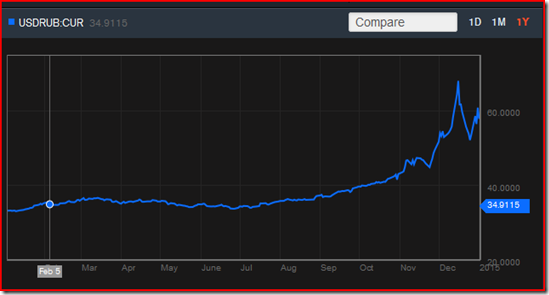
How can you keep an eye on this? Find a site that you like that shows the ruble/dollar exchange rate. Then, make sure it’s one that you can adjust the time axis on; you want to be looking at no less than a 3 month window. Here’s a 12 month window I snapped off of Bloomberg today:
image

Do note that I can’t scale the vertical axis to have a true zero. So, Bloomberg is distorting our view a bit.

What should you make of this? The sanctions were put into place in the summer. The exchange rate crisis of mid-December is the big spike. The Russian response to that, which quieted markets a big is the trough afterwards. Now note the time scale: the Russians best shot reversed their devolving position all the way back to, maybe, December 1. The slower losses of July to November added up to something larger, and they’re still there. And the exchange rate has started to get worse again since December 25.

This is not going to be fun to watch. The last time Russia had a financial crisis (1998) … we got Putin. The last time they had a crisis before that (80’s and early 90’s) … we got a coup with tanks in the streets of Moscow.

Belarus

Next up on the international financial crisis list is Belarus.

FYI: Belarus is one of the former Soviet republics. It is the one that has remained most like the old Soviets, and most closely aligned with Russia over the last 20 years.

Belarus is in crisis, and it all ties back to Russia’s involvements in Ukraine. When sanctions went in place against Russia, Belarus recognized that they were tied to Russia but without the deep pockets from oil exports. So they started isolating their economy from Russia as much as possible.

The thing is, now Belarus has ticked off Russia, while still taking a body blow from the sanctions.

Last week their dictator fired some top government officials. This was after shutting down much of their internet and retail commerce the week before.

Belarus is probably not a big deal, the way Russia would be, or the way that Cyprus was a few years back (because of all the money Russians lost there), or Greece a few years before that (because of all the money German investors can’t get back out of there).

Russia has been fairly quiet the past two weeks. Perhaps they’ve just passed the crisis along to a weaker sibling.

Friday, January 2, 2015

Why Isn’t Japan In the Toilet? Because Most People Writing About Macroeconomics Can’t See the Forest for the Trees

I’m not going to claim that Japan is in great macroeconomic shape. In per capita terms, the country may not have peaked around 1990, but there certainly was a big kink in growth rates that occurred at that time. And Japan has been struggling with weak aggregate growth every since.

But, this is not the story you’ll here in the legacy media where comparisons of (national) debt to GDP are accepted without question. To these folks, Japan has the highest debt/GDP ratio of any developed country, and is headed for a crash. Here’s a common view:

To illustrate just how woeful Japan’s fiscal conditions are now, one merely has to look at how they were in March 1945. About half a year before Japan’s military-controlled government surrendered, Tokyo was borrowing at a feverish pitch to pay for its losing war effort and the Bank of Japan was furiously printing money to cover the soaring deficit.

The central government’s debt-to-gross domestic product ratio stood at 204% at the end of March 1945.

More than half a century later, this ratio–a key measure of a government’s ability to pay down debt–is already above that milestone. The Ministry of Finance estimates it will reach 227% by the end of March next year.

That’s from The Wall Street Journal, which is supposed to know better.*

Do note, before I go on, that this is the same argument by people who worry that the U.S. is in trouble because our national debt is about 100% of our GDP (both are around $17T, give or take).‡

The thing is, this is mostly nonsense. Innumeracy at a basic level is being demonstrated here. Specifically, you can always compare a stock variable to another stock variable, you can always compare a flow variable to another flow variable, but when you compare stocks to flows you get a rate, and you need to be very careful that your interpretation of that rate isn’t nonsense.

In this case, debt is a stock variable defined in yen. GDP is a flow variable measured in yen per year. Do the math: the correct figure is not 227% but 2.27 years. Reciting that it’s 227% is a scare tactic. Stating that it’s 2.27 years sounds like nonsense because it is. This measure that they’re crowing about means that if Japan devoted all of its national production to paying off national debt, it would take 2.27 years. Except that’s silly because all the residents of Japan would starve.

Appropriate alternative comparisons, which can still show that Japan is in bad shape but which rest on a foundation of numeracy, include comparisons of national debt to national wealth (both stocks) or GDP to interest payments on the national debt (both flows).

The amazing thing is that this article actually includes the former, but, it’s down at the bottom (where no ever reads), and it’s really small (because it doesn’t tell a story that the sky if falling that will sell newspapers):

If there’s one asterisk to put after the shocking comparative figures, it’s that the debt-to-GDP ratios don’t take into account Japan’s huge asset holdings. At the end of March 2012, Japan’s central government had assets totaling some Y600 trillion, roughly half of its total liabilities projected for next March, separate MOF data show. And those assets include Y250 trillion in cash, securities and loans. Critics often say Japan’s fiscal health could quickly improve if the government sells some of those assets …

Folks, they’ve just put an asterisk on the only part of the article that’s actually coherent. Pity.

* Economists know that the reporters for The Wall Street Journal are not particularly conservative/libertarian, and can’t be expected to be an improvement over most other legacy media outlets. It’s the editorial page that sets The Wall Street Journal apart, and which upsets so many progressives.

‡ If you are worried about the national debt, please worry about the present value of unfunded future obligations, which is about 13 times larger. The problem with (announced) debt is how you make the payments to your debtholders. This means that unfunded obligations are the exact same problem, just with a different name.

What Makes Macroeconomics So Hard: Regifting One of the Oldest Ideas As a Basis for Policy

We’ve always done it this way is already a part of my “What Makes Macro So Hard” lectures.

This one is subtly different: presenting the way we’ve always done things as something new. Essentially … regifting.

Here’s Thomas Sowell discussing Obamacare:

… What is older than the idea that some exalted elite know what is good for us better than we know ourselves? Obama uses the rhetoric of going "forward," but he is in fact going backward to an age when despots told everybody what they had better do and better not do.

Around the world, that elite may be determined by different means: age, skin color, wealth, education, social affiliation. And I’m not claiming that they’re not right more of the time. What I am claiming is that there ought to be more than this as a basis for policy.

I like to think I have better sense than most Republicans/conservatives/libertarians/classical-liberals: I freely recognize and admit that Obamacare is essentially Romneycare, which in turn is largely the Republican alternative to Democrat proposals circa 1990.

What bugs me about policymakers, in this case the Democrats and Obama, is the claim that this is something new. It isn’t.

How is Obamacare old? Consider:

  • … When confronted with the fact that millions of Americans stand to lose their existing medical insurance, as a result of ObamaCare, defenders of ObamaCare say that this is true only when those people have "substandard" insurance.

    Who decides what is "substandard"? …
  • … One of the fundamental reasons why private medical insurance has gotten so expensive is that politicians in state after state have mandated what this insurance must cover, regardless of what individuals want.

    Insurance covering everything from baldness treatments to sex-change operations is a lot more expensive than insurance covering only major illnesses that can drain your life's savings. Now these mandates have moved up from the state to the federal level.

    Insurance is an institution for dealing with risks. It is a costly and counterproductive way to pay for things that are not risks -- such as annual checkups, which are known in advance to occur every year.

    Your annual checkup does not cost any less because it is covered by insurance. In fact it costs more, because the person who is insured must pay premiums that cover not only the cost of the checkup itself, but also the costs of insurance company paperwork. ...  [emphasis added]
  • ... Another way in which ObamaCare is an old political story is that it began as supposedly a way to deal with the problem of a segment of the population -- those without health insurance.

    But, instead of directly helping those particular people to get insurance, the "solution" was to expand the government's power over everybody, including people who already had health insurance that they wanted to keep.

Note the pattern in the bold emphasis I added to each quote. It isn’t about hope and change, it’s about old guys in suits and ties and their busybody enablers telling everyone else what to do.

And lest you think that I’m dogmatically opposed to the Democrats and Obamacare, let me point out that the “War on Drugs” and the “War on Terror” — which get far more Republican than Democratic support — are justified with arguments that politicians have been making for centuries.