Tuesday, March 31, 2020

COVID-19 # 42 (Required Parts Highlighted)

On Friday, I wrote, on this blog, that death tolls in the U.S. from COVID-19 would exceed those of 9/11 on Monday. I was wrong. It took until 9 am Tuesday (Utah time)

Governor Cuomo of New York has asked for underemployed medical workers from other states to come to New York and help. Emergency room visits have dropped a bit in New York. But his brother, Chris, who's been talking to him nightly on his show on CNN, is positive.

Pure speculation here, but this is what macroeconomists do sometimes. If New York wants to import healthcare workers, how long until other states move to ban the travel of healthcare workers?

Except that fake news isn't good enough: CBS News was busted by bloggers and tweeters for presenting video of an overloaded hospital in Italy as being current and from NYC. I wish I'd been the one to see it on CBS because I did see that exact video out of Italy last week.

Florida arrested the pastor of a megachurch for holding services while they are banned. I'm down with that.

Liberty University, an evangelical school in Virginia, was one of the few schools to invite students back after spring break ... and now has a positive case. Roughly 40% of the students who returned have now left again.

And ... this chart from Financial Times may help you realize that the U.S. has indeed ... blown it:
BTW: people were shocked when China handled their outbreak by locking down half the country. The U.S. now has over half the country locked down, and it wasn't soon enough.

This is a suggestion. An app is not available for this yet. New research in Science suggests that an app that keeps track of phones that were in proximity to your phone, and then told you when people who owned those phones tested positive, might be able to greatly reduce transmission.

Uh oh. A few weeks back, we had a dog and its owner testing positive. Now it's a cat and its owner. Both are from Hong Kong. No knock on their testing specifically, but it would be nice if this sort of result could be confirmed by a different type of test (there's many now) to confirm it is not a false positive. Both of these are possible, but rare for most viruses.

Again ... if things are that much better in China ... why did they push back college entrances exams from June to July earlier today? Oh ... and in discussions Hollywood studios (for which China is a huge source of revenue) China has indicated the the re-closure of theaters that took place this week is likely to last for a long time. Also, the gated apartment neighborhood called Wuhan Red Steel City 24th Street was re-quarantined yesterday evening. Also, last week it was Jiangxi (province) not admitting people from Hubei; this week its Anhui province (which neighbors both) doing the same thing. Shandong province is also quarantining some travelers from Hubei.

As I have said many times, and really tried to stress, the problem with data from China is the incentive system not the politics.
Li Keiqang, Xi's # 2 guy, has been a great help to data scientists for several years as we try to figure out what's going on in China. As per usual with China, data leaks out; today it was that they had 1,500 people test positive without showing symptoms, who were not included in outbreak totals.

Forbes published "The Coronavirus Is Becoming a Public Relations Disaster for China" by Kenneth Rapoza. It's mostly about how angry European governments are getting with China's government, so it's a perspective you may not get much in the U.S.

A disturbing video from Time magazine:
Young (very young) medical students graduating early from school, and going straight into hospitals to work with SARS-CoV-2 infections. It reminds me of movies where the young go off to fight some was they don't understand.

On a personal note, my family keeps in touch with a friend and SUU alum doing their residency right now ... they're exposed and do not intend to see their families again until this is all done.

Meanwhile, in Midland, Texas, a man stabbed an Asian-American adult and two children for "spreading" the virus.

Two ideas. Synthesize. Japan held off for a long time delaying the summer Olympics. Japan's reported cases have gone up very quickly since the announcement was made. Can you call a whole country a bad name reserved for jerks?

Lastly, TL asked an email and I covered here and in class about using PMI's as early forecasting tools. This was a while back before COVID-19 seemed like it would be a problem for the U.S. now that it has hit, a PMI for the city of Chicago is perversely going up. This is mostly because both deliveries and prices are up ... which isn't surprising when everyone is ordering everything delivered. But it's a surprise to the index number itself because this is all a black swan to the person who initially dreamed it up.

Monday, March 30, 2020

Hungary

It's only a blip on the radar screen for the few Americans who pay attention (around the 70th percentile in all 4 rankings in the Handbook), but Hungary has come up twice on this blog over the years for its increasingly nasty policies (here and here).

Hungary is part of the EU, but maintains its own currency outside the EMU.

In Hungary's defense, their policy issues have been motivated by two primary issues. First, a sense that the EU government in Brussels is too liberal for Hungary's political tastes. Second, because Hungary has been on the prime immigration route to the EU from failed states in the Middle East. If you've forgotten the news from 2015, check out these pictures. In response, Hungary built a fairly secure wall on their border.

Hungary has been run by the same guy, Viktor Orban, for the last 10 years, and 14 of the last twenty-two. He's another not-so-nice-guy that Trump seems to think highly of.

Today, Hungary's Parliament voted to give Orban the right to rule by decree, suspend parliament, and to punish journalists without trials ... oh yeah, and punish quarantine violators because there's that whole pandemic thing going on.

What's the old political saw? Never let a good crisis go to waste.

P.S. Oh ... and Hungary was on the bad side in World War I, World War II, and the Cold War.


COVID-19 # 41 (Required Part Is Higlighted)

Here's a map of Europe's summarizing the current states of emergency (darker).
For each country there's an array of 6 squares; if the top row is all red, that country's borders are closed. The EU likes to think of itself as the "united states of Europe", but it's looking a lot less united than we are these days. BUT ... Texas blocked travelers from Louisiana this morning.

In China, Xi Jinping was photographed for the first time, outside, without a mask, in almost 3 months.

Austria has made wearing masks compulsory.

A Van Gogh was stolen overnight from a museum in Amsterdam. There are rumors, but the name of the painting and the museum hit have not been released yet. It is believed that museum security was weaker than normal.

COVID-19 # 40 (Required Part Is Higlighted)

Taiwan responded to Dr. Aylward's actions (see the post from Sunday).
In their defense, staff of the WHO like Aylward do not make decisions about membership, member states do. Still, the decisions aren't about health, that's for sure.

TL recommended this page from KSL on the current state of the epidemic in Utah. Now that we have tests (14 K in Utah so far ... remember a couple of weeks ago when it was less than that for the whole country), we're finding a lot more that are infected. What I also notice is the same pattern we saw in Seattle a month ago: most tests are negative (because people have respiratory problems for lots of reasons), but the percentage is increasing. I saw something yesterday that the positive rate is up over 50% in NYC now.

TL also recommended this (8 minute) video by Grant Sanderson posted at Kottke (from the first week of March).  It's fantastic; and goes beyond some of the stuff we do in class. I like the way it emphasizes that growth is through compounding, and that lots of people have a hard time assessing how that growth will work out with the passage of time. He even shows how a logarithmic scale produces a line. Note that using this he projected on March 6th s a million cases by April 5th (we're currently at 741K worldwide, and we went up by over 70K yesterday, so I'd say we'll actually hit that mark earlier than predicted). Later on he talks about how all exponential growth of epidemics always ends up as a logistic curve; Italy is past their point of inflection, but the U.S. does not seem to be. The visual around the 7 minute mark is especially important if you think you'll be safe where you are: "If no one is worried, that's when you should worry".

Sunday, March 29, 2020

Fail-Safe System ... Failed

The New York Times piece "China Created a Fail-Safe System to Track Contagions. It Failed" is outside their paywall (maybe only temporarily).

It has a lot of new details about what went wrong in China in January. Most of the linked documents are in Mandarin.
Scarred by the SARS epidemic that erupted in 2002, China had created an infectious disease reporting system that officials said was world-class: fast, thorough and, just as important, immune from meddling.
 But it failed:
The central health authorities first learned about the outbreak not from the reporting system but after unknown whistle-blowers leaked two internal documents online.
 “According to the rules, this of course should have been reported,” Yang Gonghuan, a retired health care official involved in establishing the direct reporting system, said in an interview. “Of course they should have seized on it, found it, gone to understand it.”
 Yeah! Free press:
During a rare burst of relative transparency early in the epidemic, Chinese journalists did much to expose the problems, but censors closed that window.
But reports ran into the pyramidal structure of China's bureaucracy:
... Over time, hospitals often came to defer to local health authorities about reporting troublesome infections, apparently to avoid surprising and embarrassing local leaders.

That deference may not have mattered much most of the time. Now it gave officials in Wuhan an opening to control and distort information about the virus.

Local disease control offices in the city had counted 25 such cases by Dec. 30 ...

“The local health administration clearly made a choice not to use the reporting system,” said Dali Yang, a professor of political science at the University of Chicago who studies policymaking in China. “It is clear they were trying to resolve the problem within the province.”
 It was a joke in Men In Black, but it was reality that Beijing found out from alternative sources:
Word of the outbreak started to reach disease control officials in Beijing after rumors and the leaked documents began to spread online. The national center for disease control has pointedly avoided saying in announcements that it had been notified by Wuhan, instead noting that it had “learned of” the outbreak.
Then the foot dragging really began: 
When the central government became involved, local officials outwardly welcomed the expert investigators sent by Beijing. Officials described the infections as nothing too serious.

“They said that the illness was quite light, not much different from seasonal influenza, and there’d been no illnesses among hundreds of people with close contact,” Zeng Guang, a Chinese epidemiologist who visited Wuhan on Jan. 9, said of his talks there, according to the China Youth Daily. “They sounded very relaxed.”

Behind the scenes, officials in Wuhan mounted an effort to limit the number of infections counted as part of the outbreak, creating barriers against doctors filing cases.

A leaked report from Wuhan Central Hospital describes how in the first half of January local officials told doctors that cases had to be confirmed by bureaucratic overseers, above all, city and province health authorities.
 That goes a long way towards explaining the plateau at 41 cases for much of early January. 

Kind of interesting how, in the two largest economies in the world, foot dragging by bureaucrats who reported to the executive were the problem.

COVID-19 # 39 (Required Part Is Higlighted)

The CDC is now issuing travel alerts for U.S. states. These are not comparable to those already issued for countries. Recall that the CDC uses a 3 level warning system for countries. If it helps any with interpretation, the CDC site prominently features the color yellow when discussing New York, Connecticut, and New Jersey.

CDC is also considering making a recommendation within 10 days that all American wear the masks we don't have outside the home.

Pregnant? Plan on delivering without your spouse or a doula in the room. That's becoming standard across the country.

*****************************************

It seems like every story we here out of China starts out as an ugly rumor but ends up slowly being revealed as true. Recall that the official death toll in Wuhan is about 2,500. On February 14th I posted a calculation based on numbers from early February that 30 is normal daily business at a crematorium in Wuhan, that they were doing about 100 extra every day, and that there were 7 crematoria in the city.

Now, I do believe that China has its outbreak mostly under control, what I don't believe is the rate at which they claim to have done it, or the total numbers.

That crematorium data is consistent with about 5K deaths per week. And it was based on interviews conducted 10 days after quarantine was announced. More than a couple of weeks of that peak rate seems reasonable, followed by several weeks of it slowly declining towards zero. We're now 9 weeks from the quarantine. Just to speculate, perhaps the numbers looked like this: 5,5,5,5,5,4,3,2,1 in which case we'd get 35K deaths. Or maybe 5,5,4,4,3,3,2,2,1 in which case we'd end up with 29K deaths. Whatever, I'm just trying to get some number sense here.

Both of those are way below what would be implied if the numbers posted 3 times by Tencent in late January were actually a leak of the truth.

Now there are 3 new pieces of information that tend to confirm claims in this range. Caixin, an investigative magazine based in Beijing reported speaking to truck drivers delivering memorial urns to crematoria in Wuhan after the ban on travel into Wuhan was lifted last week. The trucks carry 2,500 urns, and the driver had made a delivery the same size to the same crematorium the day before. Note from the number above that if there had been a lockdown but no increased deaths a single crematorium would be expected to need a delivery of just 1,800 urns to cover the entire period. Caixin was also able to take a photo of 3,500 empty urns still stacked from deliveries inside the building. Both of these numbers are in the range of the 5K per crematoria calculation made above. Lastly, residents of Wuhan with green QR codes on their quarantine app are now permitted to pick up remains of family members at crematoria. The on the ground and often English-language blog shanghaist reports that the pickup rate is 500 per day at a single crematoria, and that a special pickup period has been announced that runs through April 4th. Again, if that is followed at all 7 crematoria, the back-of-the-envelope calculation is 40K urns to be collected. They also report that reporters who identified themselves as being from Bloomberg were unable to make contact with the crematoria.

And, of course, in any location, the number of urns is an underestimate of deaths. Urns and pickups are one way that crematoria pull in revenue. Sometimes families can't afford this, sometimes the family members also died, and sometimes people die without loved ones to gather their remains. And, no blame on the Chinese here at all, but just like Katrina or 9/11, I can imagine that some peoples' remains were incinerated before a positive ID was made.

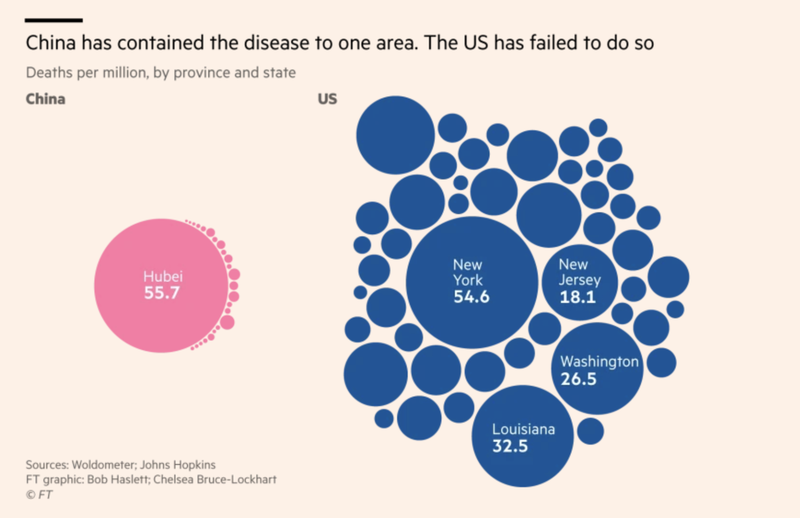
Lastly, note that these huge numbers from a country with over 4 times the population of the U.S. are still lower than the forecasts of deaths for the U.S. published on Thursday, and also proportionally lower than the current death tolls in Italy, a country with about 4% of China's population.

And, on a personal note, if you're you're interested in China (who isn't), and you're interested in macroeconomics (isn't everyone), you just get in the habit of doing this sort of digging to pin down the truth about what is going on there.

*****************************************

Now let's use our economist-brains to figure out how the Chinese situation is even worse.

It's readily apparent that China pretty much shut down half the country for over a month. In China, reducing the amount of labor used is an aggregate supply shock. In the U.S. we feel this as an aggregate supply shock as well when we have trouble obtaining goods made there. In the context of a principles-level macroeconomic model, the world supply curve (typically drawn as horizontal, since ever exporter is a price taker at the "world price") shifted up, which will tend to reduce our imports. As in:
(You can find a bazillion diagrams like this on the internet, but most of them are solutions to specific homework problems on places like Chegg). I liked this one because it was fairly clean. It's appropriate for the U.S. in this situation, our imports are the distance BC, and COVID-19 shifted "World Price" upwards.

How do the Chinese feel about that? No doubt badly. They need income just like everyone else, and when our imports go down so do their exports.

But it gets worse for China. That was the story for last month. The story for next month is that the demand from all of China's trading partners is going to shift left, because we've mostly shut down our economies now. So at the moment when China is trying to increase production, and shift "World Price" back down, Demand in the figure above is going to shift to the left. This will tend to keep our imports (and China's exports) down.

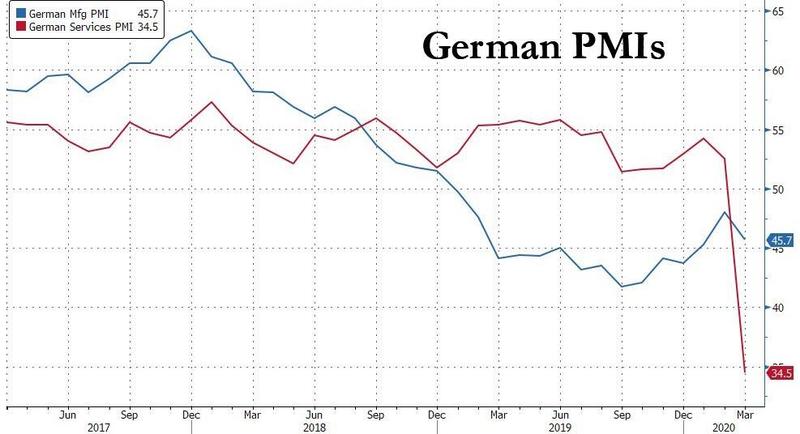
Astute students might also recognize that this is a similar explanation to why Germany could not recover quickly (and pay reparations) after World War I. Let's hope the world economy does better this time around. Here's Bloomberg with coverage.

*****************************************

But, let's go back to China bashing. There has been a worry for the last 2 months that the WHO is excessively supportive of the official tune played by Beijing, otherwise they'd get no cooperation at all. Check this out. Taiwan (which has effectively fought the outbreak), but is not a member of the WHO because China insists that after 71 years it is still a renegade province:
That's the number 2 guy in the WHO right now, badly ducking some straightforward questions. That does not bode well for the WHO as a definitive source on what happened in China.

BTW: now is the time when you need to start worrying about availability of food in the U.S. I don't expect it to be a disaster. But, what we experienced earlier this month was a demand shock to grocery stores. What's coming is a supply shock as food production sites have to shut down as workers become infected. Most of those sites are located in rural areas, like the "pig farm" in nearby Milford, where the disease will be slow to strike.

Video also surfaced, taken yesterday, showing Tongji Hospital in Wuhan refusing to take a patient in need of a diabetes related amputation. On the other hand, Hankou Railway Station is definitely open and people are traveling into Wuhan, so that's good.

The National Restaurant Association  reports that 3% of restaurants nationwide have elected to close for good rather than just until this blows over. CraftWorks, a restaurant holding company, has shut down completely and permanently. They did not have many locations in Utah: an Old Chicago in Logan, and a Gordon Biersch in Terminal 1 at the airport in SLC.

If interested, click through to Open Table's ridiculously interesting graphics on their State of Industry site. Clearly, they have to do a lot of rounding, but they show restaurant bookings for in-location sit-down meals dropping rapidly from a year ago on the same day. For example, in Utah, the last up day for restaurants was March 6. From there they dropped steadily a few points every day until the Governor's initial announcement on March 12th, and then crashed to nothing by March 19th.

The CFO of a top 10 Wall Street investment bank (Jefferies) had died. (I'm a little dubious of that ranking; so let's just say if this firm offered you a job you'd take it in a heartbeat).

Florida is stopping cars from entering from Louisiana (where the outbreak is worst). From personal experience, you can usually get from New Orleans to the beaches in the Florida panhandle without stopping for gas. I am not advocating for Trump to put in some sort of national travel ban. Having said that, in our federalized system, this is what states will do when they think the federal government is not doing enough. So I think it's disturbing, but probably needed.

Remember what I said in class that there just is not much capacity to store oil, and this makes crude oil price-elastic. Wyoming Asphalt Sour crude, a particularly poor grade used in making roads, actually had its price go negative about 10 days ago (-$0.19 per barrel). This means that producers are paying refiners to take the product of their hands. That shale oil from Alberta (another particularly poor grade) has traded as low as around $5 per barrel. Sweet crudes in the U.S. are trading in the high teens. OPEC countries, who still have some market power over some countries, are generally trading in the high 20's. In the oil industry, this is called contango (last seen in 2008); this is where it is profitable to load oil tankers, use them as floating storage tanks, and contract to sell that oil in the futures market months out. It is estimated that current worldwide oil production exceeds demand by 20%, and that we are weeks away from all oil storage facilities being full.

I don't generally watch Sunday morning news talk shows. But I'd swear by the videos I saw of Jake Tapper that he is no longer working in the studio. And university folks thought we were the only ones using Zoom.

Different places are using different things for temporary hospitals. India, which was long in denial about the outbreak, is using railroad cars. In March/April. In the tropics. It's about 2 months until the monsoon hits.

Russia is closing its border tomorrow, but more importantly will not be honoring previously issued visas. For a place like Russia, that will block foreign reporters, and help to clamp down on getting the truth out.

Italy has had 2 better days in a row again. Cases there are still rising, but no longer accelerating. Deaths are still accelerating, but the acceleration is no longer steady.

Remember triage? Remember federalism? Synthesize.† States are being proactive and putting in rules for healthcare institutions that permit triage. But, the civil rights division of the Department of Justice in D.C. is saying that violates federal law. May I suggest that if we'd figured out the state/federal conflict over medical marijuana, that we'd have a template for more serious issues when they came up.

† People often do not understand the definition of synthesize, so if I was unclear you can look it up.

New York City is reporting the highest rate of 911 calls since 9/11 (no pun intended).

There actually was quite a lot of news out of Iran today, both official, dissident, legacy media, and from the U.S. State Department. The official ones show government officials all wearing face masks. The dissident ones argue that the official announcement of an outbreak in mid-February was delayed by over 2 weeks, and that hospital staff interviewed on March 25th said they were in day 51 of dealing with patients. The Johns Hopkins dashboard puts Iran's deaths at 2,640, while dissidents say:
The dashboard says they have 38K cases. If that is scaled up by a factor of five as well, then Iran has more like 200K cases.

Interesting low-level science article from USAToday showing that there are now 8 strains of SARS-CoV-2 in common circulation. It also notes that the virus mutates slowly (unlike, say, influenza). You all learn the basic language of genetics in school, that DNA is written in pairs of bases. The virus has 30K of those pairs, and only 11 have mutated in the last 3 months.

Interesting piece on how the CDC knew we did not have enough ventilators 15 years ago, and did something about it. But the project failed because of consolidation in the medical device industry. Fair enough. But zero mention was made that Obamacare came down hard on the medical device industry, and basically forced a cost-cutting consolidation 5-10 years ago. This is kind of irresponsible on the part of the articles authors; this effect was not a secret, and both political parties have attempted to address it.

Most of you have seen the Cheyenne Mountain bunker in movies like Deep Impact or Wargames. This is not about panic, this is standard (but very rare) procedure: Homeland Security has moved a command team into the bunker in case command teams located outside the bunker become compromised.

Wildlife. I lived in New Orleans for 9 years. Not surprisingly — warmth, humidity, tourists, drunks, restaurants, cruise ships — it was rat heaven. Now that people are off the streets, the rats are out in force. This is not an unsolvable problem, but it does point to what economists call unintended consequences. And FWIW, I saw a roadkill coyote in my neighborhood on Leigh Hill the other day, and I recommend if you're staying locally that you really watch out for deer after dark.

Half-a-dozen of the stars of Contagion have produced public service announcements about COVID-19.

Saturday, March 28, 2020

COVID-19 # 38 (Required Parts Are Highlighted)

There are now 3 cabinet level people with positive diagnoses in the UK. It's starting to sound like Iran a month ago.

Here's the view from New York in "A New York Doctor's Warning" from The Atlantic.
Here, the curve is not flat. We are overwhelmed. There was a time for testing in New York, and we missed it. China warned Italy. Italy warned us. We didn’t listen. Now the onus is on the rest of America to listen to New York.
Do note that the story here is the same as Wuhan — sick-but-not-so-sick patients being sent home only to return later:
Many of my patients clearly haven’t received the message to stay home unless they’re in immediate need of professional medical assistance. Their fevers and coughs alone are not enough to even earn a test. 

...

By next week, we may simply have no choice. Those hundreds of relatively healthy patients we sent home may return to the hospital en masse in respiratory failure. On Wednesday, I greeted a patient I had discharged only one week prior. When I saw his name pop up on the board, my heart sank. He is just shy of 50, with hardly any past medical history, and he had seemed fine. Now he was gasping for air.

...

I do not want you to go to any hospital in the United States. I do not want you to leave your home, except for essential food and supplies.

...

In spite of all this morbidity, the doctors at the hospital received one piece of good news yesterday. A coronavirus patient was successfully taken off a ventilator after two weeks, a first for our Medical ICU and a victory for the staff and, of course, the patient.
That's right. A "first". After two weeks. And don't forget being on a ventilator often means being sedated and/or paralyzed in a medically-induced coma the entire time. This doctor works at Elmhurst Hospital in Queens, which seems to be the worst hit one in New York City at this time.

Here's an outbreak map for NYC

For those of you who don't know NYC, Long Island is the fat thing in the center right. Brooklyn is the dozen or so areas at the west end of Long Island. Queens is everything else to the north and eastern sides of that.The not-quite-quarantined area of New Rochelle that we were all so worried about 2 weeks ago (and have mostly completely forgotten now) is adjacent to and a little above the east side of the orange area at the top (which is almost all of The Bronx).

And there's this:

The poster is Trump's first FDA commissioner (he left that office last spring).

Yes, those are temporary hospitals on the intramural soccer fields at the University of Washington:
Not sure where you are riding this out, but that may be in your location's future. Washington is doing very, very, well ... but cases are still going up, albeit slowly.

Oooh ... and this is an interesting perspective showing when death rates are going to fall back down to sort'of normal:
Utah is in beige, which means later than some other states. That tweeter has other interesting chloropleths here and here. We are going way past Easter on this in Utah.

Don't fool yourself that we are getting this under control yet. Who got COVID-19 under control in a bad situation? South Korea, that's who. So chew on this: the U.S. had more new positives yesterday than South Korea has found in total. Yes we are several times bigger, but still.

Oh ... and this ...
Subways and banks re-opened in Wuhan yesterday. Videos leaked out show very few people using them (probably because you need that phone app to show green to get in). There are unconfirmed reports that, now that people who show green are allowed to go to crematoria to pick up ashes, that there are 59K urns awaiting pickup. That is far higher than the official number of deaths, but consistent with those reported by those Tencent leaks in late January.

BTW: it's easy to forget that the problem in Wuhan was that news of the epidemic was suppressed until the quarantine. (Recall that the positive cases somehow stayed stuck at 41 for over 2 weeks in early January, and then Beijing brought the hammer down). Anyway, there's new research by Chinese authors in Science on that. They estimate that 82-90% of cases were undocumented at the time quarantine was imposed, and that they were the source for 79% of the cases that were later documented. Again, the 82-90% number is consistent with the information leaked out through Tencent in late January. Of course, we're finding out in the U.S. this month what happens when our government doesn't document the number of cases accurately and early. BTW: Anthony Fauci asserted in an interview that Italy's problem may have been that it was a desirable destination for Chinese doing international travel around their New Year.

Iran is still dark. There are vague reports of people who get news out being arrested. Also, there's no way to know the extent of this, but countries (not just Iran) have increasingly put their internet connection to the world on one single connection that can be cut when those in charge want to (Egypt was the first one to do this back in 2011). What we are able to see out of Iran are propaganda statements about lifting the U.S. embargo. Please keep in mind that the Iran refused aid from the U.S. that was limited to just medical supplies (here's a cite for that from just about the most progressive and anti-Trump publication I can think of), and also refused help from Doctors Without Borders. Is it OK for me to conclude we're in whacky territory here? Oh ... but there are reports the government of Iran will still accept cash donations if they are sent directly to them. Freakier still ... before they were releasing prisoners ... now there's video of prisoners simply running away from prison.


OK. Chill. Take a break:
I laughed. Hope you did too.
P.S. As of last night, we're worried about one person's symptoms in my house.

SEIR Modeling

You may notice mentions of SEIR models in forecasting COVID-19. The initialization stands for Susceptible Exposed Infected Resistant. These are a form of time series models that are common in viral epidemiology. A new one was released yesterday as a white paper† through the Institute for Health Metrics and Evaluation at the University of Washington in Seattle's site for COVID-19 projections.

† White paper is a good phrase for a student interested in research or policy to learn. It does not have a firm definition. Generally speaking, it means that the paper lists no authors. So who the heck wrote it? Instead of authors it usually has the name of some institution that published it listed as the author (or the name of the directors of the institution, even though they may not have done the research themselves). Employees of that institution wrote it, usually under executive direction. White papers are often produced by government or quasi-governmental policy advocacy organizations to support the policy position of the institution with something that looks like (and don't get me wrong, it usually is) serious research.

The paper is reviewed by Carl Bergstrom in this tweet storm. Here's the money quotes "The authors find that health care capacity will be overrun [in] the US, badly, ..." and "... this is a model of successful suppression of the epidemic with no second wave."

Nationwide, they expect the epidemic to peak in 2 weeks, and to subside somewhat more slowly than it built up. Their forecast range is that at peak on April 10-11, the U.S. will need 18-74K ICU beds. They say we have about 20K of those, but this dashboard says we have 64K. I don't know who to believe. Hospital bed needs peak a little later on around April 13-14 when we will fill 118-467K beds. They say we have 183K, but according to that dashboard we have over 800 K of those that are "staffed". Oh ... and we'll be short 19K ventilators too.

What's going on here??? I think "Staffed" is a polite way of saying that they're not all all in hospitals. Where else could they be? Nursing homes. Rehab facilities. Hospice. I dunno ... elementary school nurse's offices??

They also do state level projections. Consistent with where we are now, Utah will be running late on this. Our ICU use will peak around April 20th at just over 300 beds (they're range is roughly 220 to 380). According to them, this is a shortfall of about 120 statewide. According to the dashboard we have 513 of those. We should be OK on hospital beds, where we peak out at needing 1,600-2,400, and we have 2,800 of them (5,600 according to that dashboard). Utah is also going to be short 157 ventilators ...

And some states, like New York are going to get wrecked. I am not sure when they ran the simulations posted on their website (or how often they're updated). I'm pretty sure what they show for today is a projection. Anyway, they have New York state already at capacity for ICU and hospital beds. This is consistent with news reports out of New York City, but not for the whole state (a lot of that inconsistency just points to the model not being fine-grained enough). The model predicts that in about 10 days, New York state will need 20,000 ICU beds; they have 718 (or 3,100 according to the always more optimistic dashboard cited above).

It gets worse. Total deaths nationwide should be done by mid-June at 80K. Their interval estimate is 40-160K. For perspective, Katrina was 1,300, 9/11 was 3,000, annually car accidents have been hanging around 40K for a couple of decades. Do note that the 80K number is in the ballpark of what influenza claims every year. But keep in mind that this SEIR model is claiming that because we've done all these drastic things so far, and if we keep them up, we might be able to limit it to what the flu does. For Utah, it's a little later, with 300-1000 deaths in total by early July. That works out to 3-10 in Cedar City.

These are based on an SEIR model. To an economist these make little sense: they model growth of an epidemic by assuming the spread is characterized by increasing returns to scale. Gee ... no wonder they find they always get worse. They're not impossible to parse out though, if you think of the 4 parts as columns in a spreadsheet. The basic mechanism is that the susceptible come into contact with the infected, and so a fraction of the susceptible shift into the exposed column. Some of the exposed eventually shift into the infected column. Some of the infected column shift into the resistant column who can no longer be or spread infection (unfortunately that can also include fatalities, which aren't usually modeled directly).

************************************

Take your mind back to late January? Do you remember when I pointed out that a large scale quarantine of the well has never been tried? China was the first, but of course everyone's doing this now, right?

It turns out that there's no model in epidemiology that supports this. That doesn't mean it's a bad idea. What it does mean is that it was a command-and-control political response to the epidemic that was never envisioned by people who work in public health.

Instead, in public health, they worry about quarantining the sick. This makes sense. Think of any movie or TV show you've seen about an outbreak of anything. They always quarantine the sick. Heck, that's what you do when you get a cold in the winter. No one every quarantines the well. Except China in 2020 ... and a lot of other places.

In fact there aren't many SEIQR modeling papers out there. The Q stands for Quarantine, and note from the order that it is the infected who are quarantined until they become resistant. The idea is that you reduce interactions of the susceptible and infected by quarantining some of the latter. The approach in China, and now elsewhere, was to quarantine both.

Tooting my own horn here ... and who actually found an obscure paper, read it, and put it into a spreadsheet? Yours truly. I mentioned this after class one day to TL, with the intention of showing you guys, and now I'm finally catching up with that. Their model was intended for modeling the first SARS epidemic in 2002-3, when only the infected were quarantined. Anyway, I'll email you a copy of the spreadsheet model to look over (it's kind'of innovative, and it's an unfortunate fact of modern academics that if I upload it to Canvas for you, it actually becomes property of SUU).

Here's the thing: business students always whine that they don't like math or aren't very good at math. Then they get into business majors and find out that it's the second mathiest college on campus, and mathier than a lot of science departments. You're not alone; this happens at all schools. Anyway, business students often say they can't understand the math, but then they turn around and do very sophisticated math in their spreadsheets. So while you may look at the math in the paper and honestly have no idea what it's all about, I code the stuff into a spreadsheet, and I betcha' some of you will be able to figure out what's going on.

Friday, March 27, 2020

COVID-19 # 37 (Required Parts are Highlighted)

Rhode Island is stopping cars from New York state at their border. If you watched Contagion, this happened in the movie. Rhode Island is also worried about people from NYC who have fled to second homes on the Rhode Island coast (most of you haven't been to Rhode Island ... it's really small but has a lot of coast).

Now that the U.S. has gotten around to a couple of weeks of testing, we now have the biggest epidemic in the world. That's not too surprising. We are number 3 in population, India is in denial, and China has fudged its numbers (and, in their defense, don't forget that they both ran out of tests, and out of testing capacity).

As I mentioned in an earlier post, I expected us to blow by Katrina for death tolls today. The forecasting spreadsheet I've uploaded to Canvas for cases in the U.S., when extended to deaths, predicts this will pass the death toll of 9/11 on Monday.

Shared Videos (Optional)

TH forwarded these two videos from the channel Ninja Nerd Science. They are more science-y than economics-y.

This one is mostly about epidemiology. He emphasizes that this was all accurate as of March 15. But he repeats the pangolin connection, which I think has been dismissed for about a month now.

This above is the longer one (50 min). I think it's nerdier about how the virus hurts us, and how that's going to present as symptoms.


The above is the shorter one (35 min). I know most of this stuff (I've been married to a biologist for almost 30 years), but maybe it's new to you folks. I did notice that they way he says ARDS and SIRS is hard for me to understand (that's Acute Respiratory Distress Syndrome — basically you're starting to drown in your own fluids, and Systemic Inflammatory Response Syndrome—basically your body is putting out tons of white blood cells that are attacking ... everything). A lot of this one is about why particular drug treatments might work, how ventilation helps, and how we get the epidemic under control (BTW, he makes my point from the previous post about not getting fooled into thinking SARS-CoV-2 is not much of a threat to the young).

Did you see his fistful of dry erase markers? Remind you of anyone??

P.S. If you're a book/movie nerd, part of the explanation of the effects of SARS-CoV-2 on breathing are super-similar to those Michael Chricton's first big book and movie The Andromeda Strain.

Riots In China

There have been videos popping up (and quickly being disappeared) from the internet since daybreak in China (earlier in the afternoon here) of riots. Workers in Hubei province are no longer under quarantine. Some of them work across the Yangtze River in Jiangxi province (where the quarantine was lifted a few weeks ago). Police in Jiangxi would not let them enter. Crowds gathered, and there were videos of the Hubei police attacking Jiangxi police.

Way back when, I mentioned that another thing a solid macroeconomic keeps an eye on is social unrest.

Simpson's Paradox

A good and accessible article about Simpson's paradox, that's also freely available online is Wang, Wu, Kwan, Tu, and Feng, 2018, "Simpson's Paradox: Examples," from the Shanghai Archives of Psychiatry.

I posted a video about this on my YouTube page. I don't think we have the data to be sure about this yet, but I see all the signs that the common conclusion that SARS-CoV-2 is mostly a threat to the old as a case of Simpson's Paradox.

In short, Simpson's Paradox means that you can get unusual results if you omit variables from your analysis. This is a very easy thing to do in social sciences. In the case of COVID-19, I think a lot of people see the preliminary data that we have and conclude that it's mostly a problem for the old, because mostly old people are dying. But what we are omitting is what, in epidemiology are called confounders, but which in regression analysis in economics we might just call omitted variables. What I suspect is that SARS-CoV-2 deaths during COVID-19 are more about those confounders and less about age than we think.

This means we may see a lot deaths amongst young people who have those confounders. And you all probably know some people at SUU or in the SoB that have some of them.

In addition, young people have a set of confounders that. old people don't have as much, but which can be likely to require ICU care. Specifically, SARS-CoV-2 is a threat to healthy young people who: get in car accidents, attempt suicide, are involved in violent altercations, have problem pregnancies, or find out for the first time that they're severely allergic to something.

******************************************************

And, as long as I have your attention, let me give you an example from macroeconomics and public policy. If you want to go read more on this, check out the article entitled "Surprise  Florida and Texas Excel in Math and Reading Scores" from the New York Times. My copy is corrupted, so I don't have an exact date, but I believe it is from October 2015.

Anyway, most people are certain that the schools are worse in places like Florida and Texas than they are in places like California. That might not be so.

What the data shows is that, within the group of white students, average scores are higher in Texas and Florida than in most other states. And, within the group of African-American students, average scores are higher in Texas and Florda than in most other states. But, no matter where you are, average scores for African-American students are lower than for white students. Except that Texas and Florida have more kids from the weaker group and fewer from the stronger group. And when you just look at the overall average across all students, Texas and Florida are towards the bottom of states ... even though they're better than most if you include the confounding variable of race.

Here's a report from the (definitely) Democratic-oriented, but possibly too old school to be progressive-leaning, Urban Institute noting this same thing.

COVID-19 # 36 (Required Parts are Highlighted)

Check out this video. It is not that long, but pay attention. It isolates cellphones along Miami Beach last week (remember the covidiots on spring break?), and then tracks where they went.

I'm from back east. This pattern is not really surprising: most people in Florida come from the stretch along I-80 and I-90 running from Chicago east to Boston.

The Prime Minister of the UK, Boris Johnson, tested positive.

Yeah ... cases and deaths softened for a couple of days in Italy, but they're back up again.

Remember Hurricane Katrina? The U.S. death toll from COVID-19 will probably pass that by the end of the day. Remember 9/11? We'll probably pass that next week.

China has an internal threat level for the outbreak. It has 3 levels. Wuhan has been reduced from the worst one, to the medium one.

Seattle, which started out bad, seems to have flattened its curve. The thing is, in the Seattle area, it was really bad inside a nursing home, but not too bad outside of it. So they may have had an advantage in self-quarantining that other areas may not.

FWIW: I used self-quarantining in the previous sentence. This phrase is so popular that it will now come in spell checkers.

Bad news. If you scope out the outbreak maps, Salt Lake City, Boise, and Denver look like some of the worst parts of the country. Nothing like NYC, but what is?

Thursday, March 26, 2020

COVID-19 # 35 (Required Parts are Highlighted)

If the data from China is to be believed, the outbreak in the U.S. is now worse. Current estimates are that China's population is about 4.4 times that of the U.S. But China claims to have only had 1.3 times as many cases, and 3.6 times as many deaths.

About that data fibbing from China. Pay close attention to the number of recoveries vs. deaths. Do note that in the graph below, taken from Wikipedia, there is a glitch in the view, skipping 9 days, that causes the big jump in the middle.
On the other hand, Italy's data looks like this:
Roughly the same number of cases and deaths, but Italy isn't showing very many to have recovered. I don't think China is fibbing about recoveries: I think they were triaging, and pushing more healthy people out of hospitals and counting them as recovered (which most of them probably did). But I absolutely think it shows a health system at full capacity during a still ongoing epidemic ... and the red bars don't show that at all. Now, it's not entirely fair to point fingers at China. But, having said that, the pattern we see in Italy is common in many countries now, while the pattern in China is present in no others.

New York City is in trouble. The current forecast is for all 1,800 ICU beds in the city to be full by Friday. There are currently almost 4K people in the hospitals there for SARS-CoV-2. I believe this article entitled "13 Deaths in a Day: An ‘Apocalyptic’ Coronavirus Surge at an N.Y.C. Hospital" is freely available from the New York Times.

Wednesday, March 25, 2020

COVID-19 # 34 (Required Parts are Highlighted)

It's simple, but this is a good summary:
Not sure about the positions on the curve, but I think the countries are ordered correctly.

India has locked down the entire country. That will try this with about twice as many people as China did.

Italy's daily death total popped up again. I am hopeful that is random noise in the data.

China announced that all restrictions in Wuhan will be lifted by April 8th.

Electricity consumption in Italy is off by 16% (the story is here, but the data from Bloomberg appears to be proprietary). That's comparable to my earlier post about energy use in China about 5 weeks ago.

Also, I feel like a total jerk for dissing PMI data(s) in class. I guess I should add that when it's too early to have all the data, and data is OK ... and PMI's do cross our desks fairly promptly. Anyway, the PMI's coming out of Europe are disastrous. Here's Germany's:
Services are harder hit because they require a lot interpersonal activity. Don't forget that for any rich developed country, service account for about 2/3 of the economy.

Yes ... time for movie reviews!

I bit the bullet and rewatched Contagion for the first time since it came out (yeah for easy cancellation policies for free trials of streaming services). It has huge similarities to the situation we're in right now. A new virus gets a start in China (Macau instead of Wuhan). It also comes from bats. Public spaces are commandeered for makeshift hospitals. Doctors get sick and die. People do unethical things, like spreading news of false cures on the internet. Young people do dumb stuff. But it also has dissimilarities. It's not a coronavirus, it's a paramyxovirus (like mumps, measles, and RSV). In the movie the virus goes from bats through pigs to humans. It's R0 is much higher: around 20. It's also a lot deadlier than our real one, with a fatality rate of 25%. Put those two together and they have a lot more deaths. Society breaks down much more seriously;there's little mention of shortages, but fairly quickly there's lots of thefts and looting. But they're able to develop a vaccine relatively quickly (we're still working on one for the first SARS). Anyway, if you can't handle it, don't watch. But it's pretty good "pandemic porn" if you do.

I had actually rewatched Outbreak for the heck of it around Thanksgiving, so it's still fresh in my mind. Their disease is far deadlier. But it also must have a much lower R0. It's more like Ebola (which is closer to a paramyxovirus than to a coronavirus). There's way more of the bad military tropes in this movie, and people in hazmat suits. It's not very similar to where we are now. Definitely engaging though.

My kids and I have a plan to rewatch Twelve Monkeys this weekend. Not at all like our current situation, but pretty freaky nonetheless. Warning: Terry Gilliam movies are not for everyone. But if you like crazy plot twists, this one is for you.

If you like oldies, I recommend Panic In the Streets. It's in black and white, but is streamable if you can find it. It's much more into the early public health aspect: how do we find the really small number of sick people so the epidemic never gets started. FWIW: I lived in New Orleans for most of the 90's, and while it's set in 1950, it has serious New Orleans ambience.

COVID-19 # 33 (Required Parts are Highlighted)

Here's some very cool data. Click through to see more charts:
In these charts, the pink is normal, and the gray underneath is current. Each day has 2 spikes, for morning and afternoon rush hours. The weekend is on the right. Data is from last week: Rome and Madrid were already dead, Paris shut down on Tuesday, London a little bit starting on Friday. Here's the thing though: Beijing and Shanghai are showing almost no traffic during the day (people are going to work, but staying there), and not much traffic on the weekends, so they are still partially shutdown. Wuhan has non-existent traffic, even though the place is supposedly returning to normal (BTW: there are videos online of patients being pushed out of hospitals ... remember those perverse cash incentives they set up?). The tweet storm that follows shows other stuff, like energy use, and movie boxoffice revenues.

Here's a very cool interactive graphic from the New York Times showing how the virus spread. Be prepared to wait, it takes a lot of time to load.

MJT forwarded this site that tracks social distancing. Utah is doing OK, but that is almost all through the Wasatch Front. Iron County is doing lousy. BTW: first positive in CC yesterday; was related to travel.

Monday, March 23, 2020

COVID-19 # 32 (Required Parts are Highlighted)

I pick on China a lot. I hope they don't take it personally. Let me pick on India instead: they're lying too. India claims they have 425 "confirmed cases". The key word there is confirmed: if you don't confirm them, you don't have them. Anyway, in a country with few cars, they have shut down public transportation. Sometimes it's better to pay attention to the non-numerical rather than the numerical data.

Continue to have your thinking cap on whenever you hear about a record increase in cases. Of course the increases are a record, that's how the math works. Expect this, and ignore the journalists just looking for new stuff to write and say.

There's initial research out on disease features in Italy. Median age of those who tested positive is 69. Hospitalization rate was 47% amongst those testing positive. ICU admission rate was 18% of those testing positive. Serial interval was 6.6 days (recall that one is how long from when you show symptoms until the person you infected shows symptoms). R0 estimated at 3.1 (recall that this is the average number of people infected by each person, and that it is around 1.2 for the flu and initial estimate for SARS-CoV-2 from China were just over two).

But, there's a worrying bit about Italy's data too. The death/recovered ratio is 82%. Italy still have over 50K people in earlier stages who are neither. That would suggest they're still looking at 23K deaths, or more.

Bored? The New York Public Library has an app that allows you free download access to over 300K titles. The app works the same way as a library — if you check something out, someone else can not, so don't abuse it. BUT, 300K is a really big set of titles to choose from.

Just one more note to freak you out. I mentioned that Iron County has only 6 ICU beds, right? Well, Beaver, Millard, and Garfield counties have zero, and while there are not that many people that live there, they're probably coming here first.

The Epoch Times (not a supporter of the government in China) has more on the missing cellphone accounts. They count 21 million missing accounts that have gone missing over the last 3 months (that's based on official, publicly available, data). Keep in mind that everyone in China is now required to be able to display a health app on their phone to move about outside their homes. This is not a seasonal drop off: last year cellphone accounts went up by 24 million over the same quarter. While adults in China are allowed to have up to 5 accounts, there are 1.15 accounts per capita. One innocent possibility is that the 300 million Chinese who migrate internally for work maintain accounts in two locations. Perhaps they went home for the holidays and discontinued the account where they work. This seems unlikely, given the desirability of jobs in richer urban areas. As always, check the math: the official death toll can account for 0.02% of the missing accounts. While it really can't even qualify as circumstantial evidence, the account loss is so large that even a small inaccuracy in that percentage would correspond to a large number of unreported deaths.

In a similar vein, Hubei province put 40 mobile cremators, typically used for biological waste, into service on February 16th. Each is capable of processing up to 30 bodies per day. It's not clear if they are still running. However, keep in mind that the outbreak was supposedly winding down by this point.

Either way, both the above paragraphs point to the Chinese experience, as officially tallied, as not being a good way to measure the severity of the outbreak in Italy, and as an underestimate of what is likely to happen in the U.S.

Our son goes to the U. While he does not live in campus housing, he has, so we are still on the mailing list. Here's what's new this morning: while they have let students remain in the dorms voluntarily through the end of the semester, they have started a plan to push them out prematurely. This will be involuntary, and is due to guidelines about population density from the CDC. I wonder if SUU will do the same?

Good news:
The "health QR code" is the phone app that shows green, yellow, and red depending on your level of quarantine. On the other hand, there's this video from last Wednesday:

The issue here is that they won't let a nurse pass the barricade to get in to their neighborhood because they don't have written permission to go home. There are also videos showing a temporary hospital in Wuhan that was "closed":
In fact, what happened was that it was disassembled and reassembled overnight on the outskirts of town.

Sunday, March 22, 2020

COVID-19 # 30 Update

I wrote yesterday that the timing seems to be about right for Italy's outbreak to start leveling off (this was based on just data sense, I had run no estimates of this yet).

It's just one day, but today's numbers look a little better. Raw numbers of cases are still growing, but the daily percentage growth rate dropped quite a bit today. And the daily percentage growth rate in deaths dropped as well.

The Hammer and the Dance

A colleague recommended this article entitled "Coronavirus: The Hammer and the Dance" that was published on Medium.

Lots of good charts, some of which you've seen before.

Not so good on the axes (I had to get that zinger in there).

Fairly broad and shallow on potential policy responses and how we can expect things to work out.

Saturday, March 21, 2020

COVID-19 # 31 (Required Parts are Highlighted)

A few hours ago (just before midnight there), the government of Italy upgraded their response to COVID-19. It is now a 100% shutdown of all non-essential establishments.

COVID-19 Will Hit Some Areas Harder

Remember what I said back in early January: that macroeconomics is about geographic correlation?

Utah comes off better in this article entitled "Age and Social Vulnerability in the Context of Coronavirus".

In it, John Nelson of ESRI shows the counties across the U.S. with either a high proportion of seniors (more susceptible to the disease) or with more socially vulnerable people (with presumably less access to healthcare).

The southeast and the midwest are going to get hit hard.

Some Infection and Hospitalization Scenarios

Remember what I said back in early January: that macroeconomics is about geographic correlation?

ProPublica put together this article with 9 national maps of scenarios at the hospital region level (since hospitals often draw from a region much larger than a city or a county). The maps aren't interactive, but it does allow you to chart out how the region you're in will fair in each scenario. Importantly, it also shows baseline hospitalization usage, which is expected to continue.

It's not pretty. The western U.S. will fair worst. I'm not sure why this is, but I suspect it's because university teaching hospitals require a large population to support, and that's mostly found back east.

(This may be my easterner prejudices showing, but I also wonder if it's because distrust of doctors and hospitals seems to be more of a western thing).

Hospital Bed Dashboard

Remember what I said back in early January: that macroeconomics is about geographic correlation?

You may have need for the U.S. Hospital Beds Dashboard. It's interactive; you need to click through and play with it.

It allows you to drill down from the country, to the state, then county, then individual hospital level to see the number of beds, the number of staffed beds, the number of ICU beds, utilization rates, and the capacity to increase number of beds.

Utah has 513 ICU beds. On average about 200 of them are occupied. Given Italy's 10% rate of ICU cases per total cases, Utah will be in trouble when we start getting above 3K positive test results. Given that the outbreak doubles every 6 days, and we have 136 positives right now, that's less than 30 days out.

But, there is the caveat that we won't get all of those people in ICU beds all at once, so that estimate will get stretched a bit.

COVID-19 # 30 (Required Parts are Highlighted)

Italy continues to get worse. There's no science for this yet, but the timing seems right to me for things to start to level out there in a week or so. It's happened in Codogno and Vo, which had a 2 week headstart. Cross your fingers.
Keep in mind that we have 5 times Italy's population.

The U.S. now has 86 million people in a China/Italy style lockdown: the states of California, Illinois, New Jersey, New York, and Pennsylvania. New York is leading the country in testing:
That's why probably no one you know has it. Here's the scary epidemic time-lapse map:
Not really surprising, I suppose.

Cool chart on social distancing: China got average daily human contacts down from 15 to 2:
Note in the panel on the right, they greatly reduced contacts by the young. The thread notes that the lines in the middle correspond to age dispersions within families.

In Europe, ICU patients are now being sent across borders (from Grand Est region in France to Baden-Wurttemberg region in Germany).

China continues to get weirder. They've now banned Chinese citizens from working for the big 3 U.S. newspapers, and have asked other American media outlets to give the government of China lists of the names of their employees in China. As recently as Thursday, Emily Feng (an American working for NPR, based in Beijing) argued that tossing out other American reporters might open the door for just such Chinese reporters as these. Personal Note: the macroeconomist in my head never quite turns off, and I'm starting to think there's a lot more to this story than just petulance about stories in our papers.

Nothing from Iran. Uh-oh.

So how are we to figure out what is going on within China? The same way Li Keiquang does it! Alternative sources, that's how! China Mobile, the country's largest cellphone carrier, reports that subscribers are down by 8 million since our new year.
Sooooo ... while in quarantine a lot of people decided they didn't need their phones? There's tangential evidence that subscriptions are off a total of 7 million at China's other major carriers.
The outbreak is ramping up in Hong Kong, which has been able to socially distance itself from China just a bit. High school diploma exams were just postponed for a month. They were set to start later this week. There was a also a new video released this week of a temporary hospital being built in a stadium in Wuhan. Also, the schools are still not open in most provinces, the borders with friendlier neighbors North Korea and Russia are still closed, and the Lianghui (national political conference) has not even been rescheduled.

There's more evidence in the flu data that ... for a while the people going to hospitals with the flu have had something else:
The green is positive tests for flu. The dark blue is negative for flu, so the top line is people going to the hospital for flu-like symptoms. There are definite upticks in January in many locations. On the other hand, a problem with this is if cases of SARS-CoV-2 are doubling every 6 days, it's hard to reconcile with it being widespread in the U.S. more than a few weeks back (even with minimal testing). Tip: don't forget, you have to read graphs like this in terms of vertical distances, not areas shaded.

BTW: I mentioned in class that Iron County has "about 10" ICU beds. The correct number is six. I presume IHC is working on ramping that up.

Here's a great hand washing video (retweeted by Ava Duvernay of all people). Watch and learn.

The border between the U.S. and Canada closed at midnight. That is the most heavily traversed border in the world.

Hopeful news: some of you may have clicked through on some of my news items from the twitter feed of health reporter Julia Belluz (@juliaoftoronto). She had a baby the other day, and covered the outbreak until just before. :)

Bad news: Australian friends of ours have tested positive. They are older than us, and she is immunocompromised. (No worries for you, we haven't seen them in person in a few years).