Sunday, November 10, 2019

Because People Lie, and Some Believe Them

This has been going on in richer, developed, countries for about a century (and it is a macro issue if there ever was one):

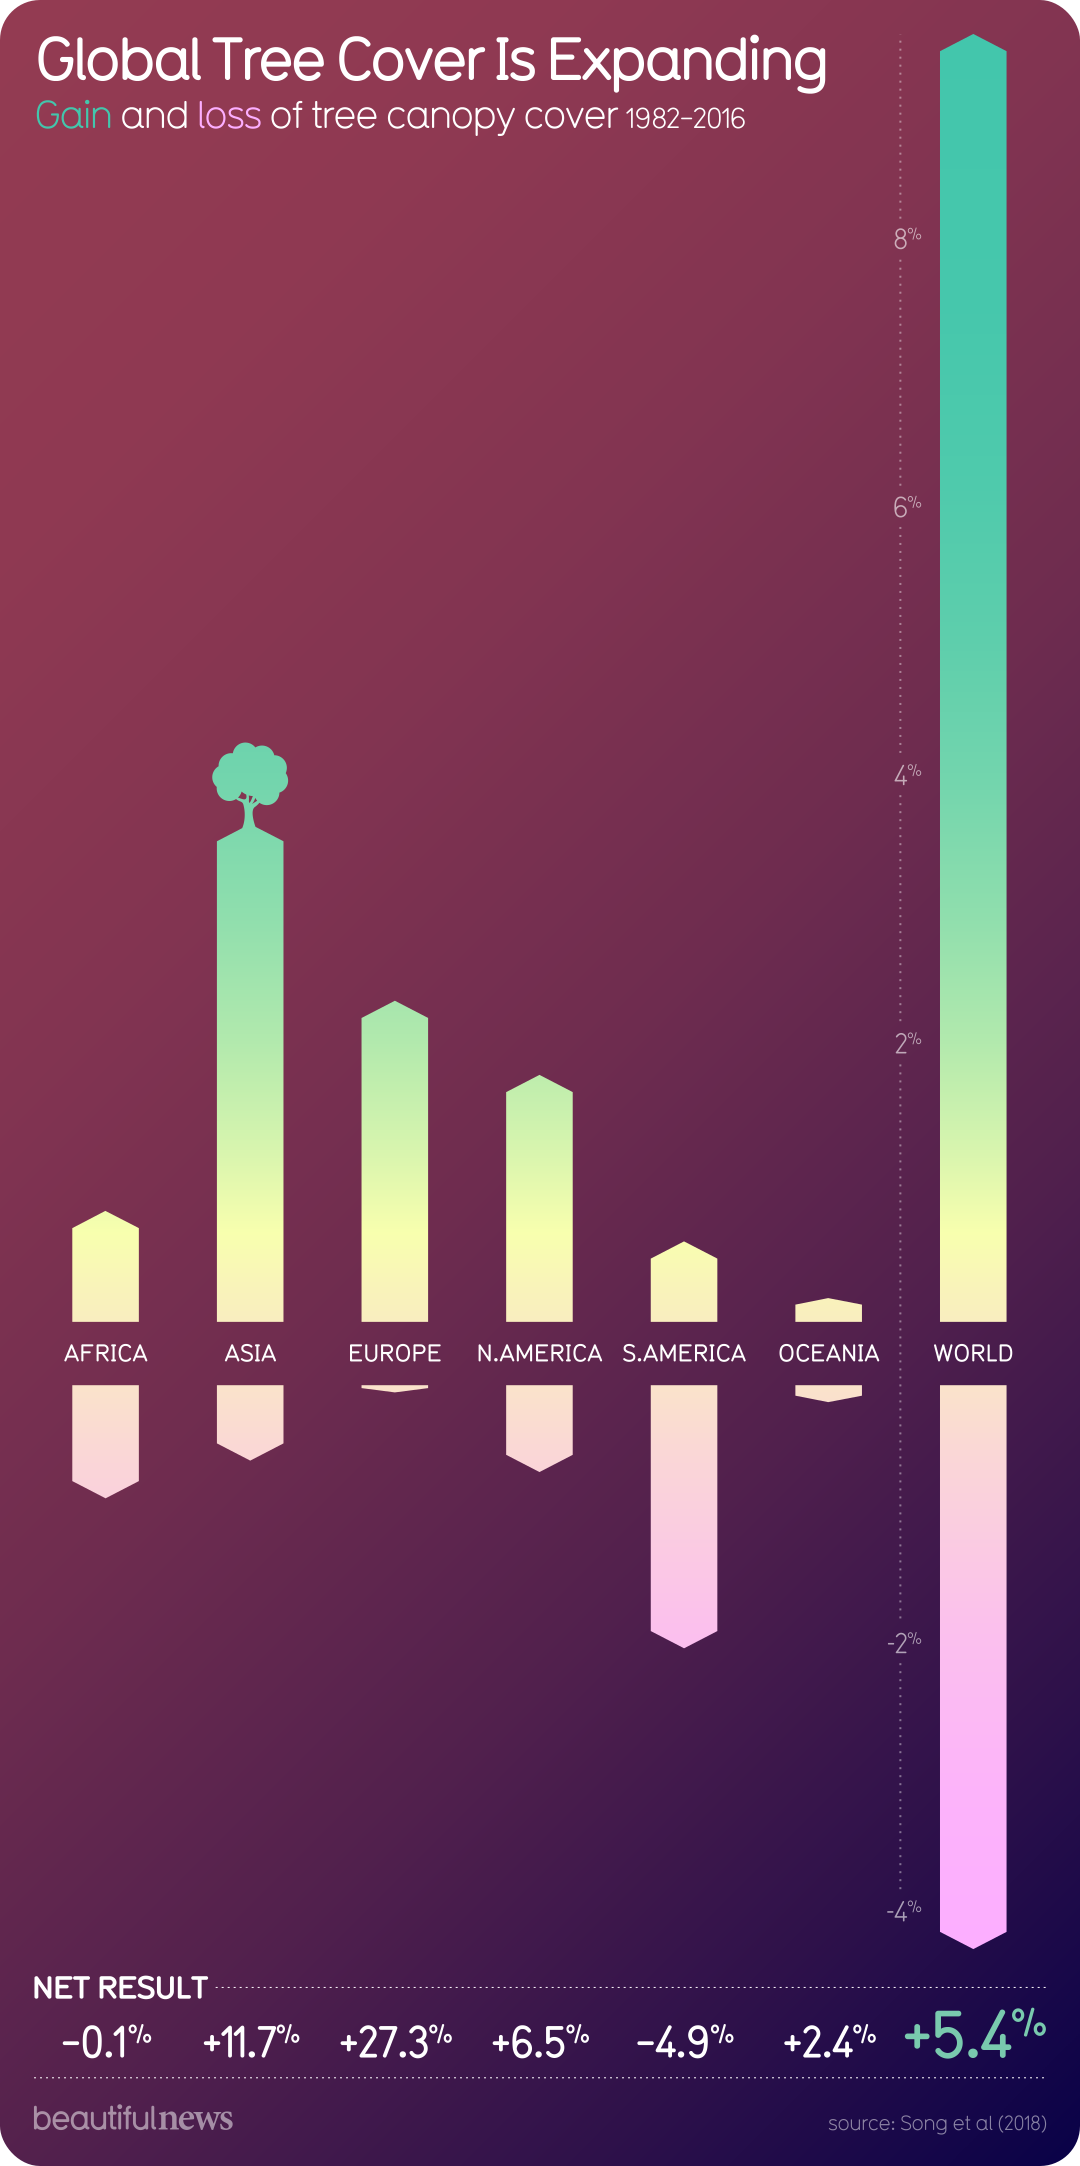
Global Tree Cover Is Expanding

It is happening globally, on net. The focus on burning and clearing in South America, Africa, and southeast Asia is not a bad thing, but it is rarely tempered by this simple fact.

And do note that may people will complain about the quality of the recovering trees and forests. That is not tempered by any evidence that it is worse than what poor people are taking away in the tropics.

FWIW: The area that I grew up in the far outer suburbs of Buffalo, NY, is now almost completely forested. It was farms a century ago. My first apartment was an old farm house, where the farm had been taken over by trees decades before. My second apartment was a new building on a property that had been a farm, and which had returned to woodland. They later cleared much of that, put in a subdivision … and planted a ton more trees.

This infographic is from BeautifulNewsDaily which maintains links to all the source data used. And I don’t think anyone would call it a Republican-oriented site.

Monday, November 4, 2019

Extreme Poverty Diminishing

From BeautifulNewsDaily:

Extreme poverty is decreasing

Essentially all of this took place in countries with predominantly capitalist economies. Then again … macroeconomists have been noting that for decades.

BTW: “diminishing”. that is, going towards zero, is a better choice of words than “decreasing”, which is going towards negative infinity.

Friday, October 25, 2019

Fakers? Perhaps Not.

It’s a common thing to view welfare recipients as unmotivated. (Personally, I don’t hold that view, but it’s common enough for me to put it in the title of this post).

That has some overlap with lazy, but it isn’t quite the same thing: you could be one without the other, or both.

However, unmotivated could also be a function of background or environment. So it’s possible that if a welfare recipient is unmotivated to get a job, it’s because they were previously unmotivated to get the skills to be gainfully employed.

Whatever. Can we test for this with data from the real world? Manal Dashpande, a recent Ph.D. student from MIT, now on the faculty at the University of Chicago, has been researching this (here is an older draft of her paper, and here is a summary more accessible to undergraduates).

To do work like this, you look for a “natural experiment”. In short, this means that somehow the circumstances of the people you’re interested were changed, and they had to respond to this change, but they weren’t capable of influencing how or when their circumstances were changed.

Deshpande looked at the change in welfare in 1996. There was a “bright line” cutoff that made the natural experiment possible: children were treated differently based on whether or not they turned 18 before or after August 22, 1996. For a particular form of welfare (SSI), prior to that cutoff, if you got it (as an adult) before the cutoff you automatically got it afterwards. After that cutoff, if you got that form of welfare as a child, you had to be reevaluated when you turned 18. About 40% of childhood recipients were denied as adults. The motivation for that was that some conditions, say mild mental retardation, may incur extra expenses in childhood, but don’t affect a person’s ability to get and hold a job.

One comparison Deshpande made was the income performance of people whose benefits were removed at 18 versus three other groups. One was those who stayed on SSI after age 18 (they were not denied benefits at 18). A second were those who applied for the first time as adults but who were denied (you might call those “fakers”). The third were children whose families had received AFDC (that program was replaced by TANF, which we still have), a program targeted at low income families rather than disabled children (you might call these “poor yet able”). Here’s a chart of their income performance:

DespFINAL2

The “poor yet able” are the red points: their income rose through time. The “fakers” are the maroonish-purplish points: their incomes also rose. In both cases the rise was up to an average of about $15,000 per year in income. That’s not a lot, but since it’s an average, it indicates that some portion of them were able to do better than minimum wage employment.

The people who were retained on SSI are the dark blue dots at the bottom. Their incomes outside of welfare stayed close to zero, but were supplemented by those continued welfare payments.

The light blue dots indicate that welfare reform may have been to aggressive. Children who were denied benefits when they turned 18, on average, had income that never approached those of more advantaged youth. Deshpande estimated the present value of their income loss at $76,000 over the ages of 18 to 34.

Basically, welfare reform was a big tax on some low income people: being raised on welfare is a condition that hurts your future income prospects. That’s not an argument for getting rid of welfare, but it probably does mean we need to do a lot more to condition recipients to use it as a leg up on their future.

Via Marginal Revolution.
Monday, October 14, 2019

FOH for FMOOWMP (Office Hours)

Students have big trouble with this … especially early in their college careers.

Hat tip to these two pieces from NPR on how to overcome your fear of office hours, and how office hours are particularly foreign to students from rural areas.

FOH for FMOOWMP (Office Hours)

Students have big trouble with this … especially early in their college careers.

Saturday, September 14, 2019

Test Post

For some reason a post will not load up here. You can see it by clicking through to my personal blog: it’s entitled “An Interactive Chart of Real GDP Per Capita Improvements”.

Saturday, August 24, 2019

A New Progressive Counterpoint About Median Income Over the Last Two Generations

I’m not going to offer any cites for this; it’s a commonplace for Democratic-oriented people to say that incomes have stagnated over the last two generations (say,back to somewhere in the 1973-1982 range). This is usually based on data from the Census Bureau, whose data is more favorable to that position.

This is countered by many economists, whose professional position gives more support to the  Republican-oriented parts of the public. The economists argue that the finding that incomes have stagnated is an artifact of using price indices that systematically overstate inflation, thus making real values lower than they should be. Former Senator and Texas A&M macroeconomist Phil Gramm had a piece with John F. Early (a former assistant commissioner of the Bureau of Labor Statistics — whose overstated inflation measures are at the core of this problem) in The Wall Street Journal just the other day, making this point (entitled “Americans Are Richer Than We Think”).

Mark Thoma (a macroeconomist at the University of Oregon), via Marginal Revolution, pointed me to the blog of Richard Green (a macroeconomist at USC). And he makes an interesting new point that tends to support the progressive side of this debate. Due note that he uses the Census Bureau data, so someone should apply the Gramm and Early critique to it at some point.

Phew … that’s a lot of background in a small space. Anyway, he asserts that the problem is a bit worse because we have a greater share of the population in the bins whose income has stagnated the most. He provides the following table:

Share in Age Category Median Earnings (2017 $)
1980 2017 1980 2017
15-24 0.216 0.120  $13,057  $13,734
25-34 0.232 0.183  $44,252  $40,575
35-44 0.161 0.167  $56,911  $52,403
45-54 0.136 0.169  $56,732  $53,985
55-64 0.127 0.165  $45,200  $48,863
65+ 0.127 0.196  $20,845  $32,654

Here’s what’s going on. The first row, people probably your age, have improved a bit from 1980 to 2017. That’s the two columns on the right. But there’s a lot less of them. That’s the second and third columns from the left.

The big problem is that there are 3 rows of people in their prime earning years, 35-54, who are both doing worse, and who are around in greater numbers.  These are somewhat offset by the two oldest rows (which correspond to baby boomers and older).

Personally, I hate most of the other names for generations (there’s a demographic reason to have labeled baby boomers with certain dates, but I feel the others are just random marketing choices). Anyway, other people do use them, and according to Green, it is Generation X and Millenials who are hurting, and that does correspond to general perceptions out in the public.