China has been asking other countries for medical supplies, because they are burning through what they have. This is problematic because China is the largest producer of many supplies.
But there are exceptions. The largest producer of gloves is … Malaysia. They had 18 million on hand, and have started shipping them to China.
Do not know about other basic supplies.
FWIW: In recent American disasters, we’ve also complained about our governments lack of stockpiles. On the other hand, we’ve found out that firms like Walmart and Home Depot have disaster preparedness stockpiles.
Friday, January 31, 2020

Thursday, January 30, 2020
COVID-19 #03: (Required Part Is Highlighted)
Germany is reporting human to human transmission prior to display of symptoms. This is what makes the common cold so … common. You’re most contagious before you know you have it. Both the new virus and the common cold are coronaviruses.
China has asked other countries to ship medical supplies. This is a bad sign since China is arguably the world’s largest producer of most medical supplies. There are credible images of masks being tossed over the border fence from Burma.
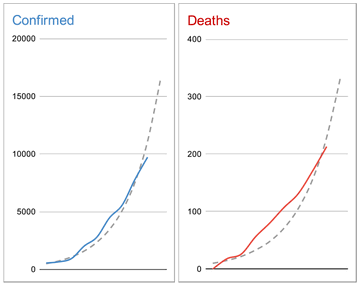
This sort of chart forecasting confirmed cases is using essentially the same techniques you will be learning in the middle section of this course:
I noted the other day that it is a short move from restrictions on travel to restrictions on trade. While it is a minor border, Kazakhstan has closed its border with China to both.
There are estimates out that the epidemic may shave 1% of China’s real GDP growth for 2020. That is roughly $150B.
This image is confirmed authentic:

China is attempting to build a new hospital in Wuhan in 10 days (the video of this showing different colored vehicles is mesmerizing). China is building a physical steel and concrete hospital because this is what they can do; in the U.S., both the CDC and the military have pre-fabricated mobile hospitals for this.
The U.S. has gone to Level 4 travel advisement. This isn’t a restriction, but rather a position that you should not travel to China at all.
Many Chinese are in self-imposed quarantine. They are healthy but getting bored and low on food.
Italy has quarantined a cruise ship due to a suspected case on board.
**************************************************
Videos below here are best viewed as unconfirmed:
Believe this video from Tuesday is of a deserted shopping district is in Wuhan.
Apartment doors barred shut from the outside in Jiangsu, to keep infections in quarantine.
Charitable distribution of face masks in Hong Kong.
Monkeys at Mount Emei that are normally fed by tourists looking confused.
I am not going to link to epidemic porn, but there are also multiple videos available of people collapsed in public places going unaided.
China has asked other countries to ship medical supplies. This is a bad sign since China is arguably the world’s largest producer of most medical supplies. There are credible images of masks being tossed over the border fence from Burma.
This sort of chart forecasting confirmed cases is using essentially the same techniques you will be learning in the middle section of this course:
I noted the other day that it is a short move from restrictions on travel to restrictions on trade. While it is a minor border, Kazakhstan has closed its border with China to both.
There are estimates out that the epidemic may shave 1% of China’s real GDP growth for 2020. That is roughly $150B.
This image is confirmed authentic:
China is attempting to build a new hospital in Wuhan in 10 days (the video of this showing different colored vehicles is mesmerizing). China is building a physical steel and concrete hospital because this is what they can do; in the U.S., both the CDC and the military have pre-fabricated mobile hospitals for this.
The U.S. has gone to Level 4 travel advisement. This isn’t a restriction, but rather a position that you should not travel to China at all.
Many Chinese are in self-imposed quarantine. They are healthy but getting bored and low on food.
Italy has quarantined a cruise ship due to a suspected case on board.
**************************************************
Videos below here are best viewed as unconfirmed:
Believe this video from Tuesday is of a deserted shopping district is in Wuhan.
Apartment doors barred shut from the outside in Jiangsu, to keep infections in quarantine.
Charitable distribution of face masks in Hong Kong.
Monkeys at Mount Emei that are normally fed by tourists looking confused.
I am not going to link to epidemic porn, but there are also multiple videos available of people collapsed in public places going unaided.
COVID-19 #02: WHO Declares (Required Part Is Higlighted)
The World Health Organization has declared the coronavirus epidemic to be a public health emergency. The only other ones are for polio and Ebola.
Helen Branswell, who is providing some of the best coverage on this relays that WHO have just under 8K confirmed cases (a little below what SARS did in total). But they also have 12K suspected cases (Chinese sources also report that heavily hit hospitals ran out of test kits several days ago). China reported almost 2K positive test results yesterday alone.
The CDC has also reported the first human to human transmission in the U.S. There are now cases in 18 countries.
FWIW: If you’re not on Twitter, this is what Twitter is for.
Helen Branswell, who is providing some of the best coverage on this relays that WHO have just under 8K confirmed cases (a little below what SARS did in total). But they also have 12K suspected cases (Chinese sources also report that heavily hit hospitals ran out of test kits several days ago). China reported almost 2K positive test results yesterday alone.
The CDC has also reported the first human to human transmission in the U.S. There are now cases in 18 countries.
FWIW: If you’re not on Twitter, this is what Twitter is for.
Tuesday, January 28, 2020
COVID-19 #01: This Year’s Coronavirus Epidemic (Required Part Is Highlighted)
Macroeconomists do watch this sort of thing: it is definitely macro, and it might be economic if it gets bad enough. I have done posts like this, or covered topics like this, in this class before.
Here’s how many of the details fit together this time:
Here’s how many of the details fit together this time:
- An epidemic started in China in December, and was reported to the World Health Organization on 19-12-31.
- It is not a big epidemic yet (several thousand confirmed ill) so far, but it is widespread. Here’s the current map.
- It is not particularly dangerous: death rates are about 3%. But they don’t really know how many people are ill or how many have died, so that number could be off. Keep in mind that plain old influenza, when it is bad enough to require hospitalization, has a death rate of about 10%. In both cases, most deaths are in the old, the young, or the previously ill. Neither appears to kill through the primary infection, but through opportunistic secondary infections.
- It is contagious, but not terribly so. The measure for this is pronounced R-nought, and it’s the typical number of new people infected by one sick person. Estimates are that this is in the 2 to 5 range, comparable to the common cold, and more contagious than influenza (1.2), but nowhere near as contagious as measles (15).
- Coronaviruses are fairly common, and not usually too horrible. The common cold is a coronavirus. But so are SARS and MERS. We don’t know what the new one is like just yet.
- Why China? In short, pigs, ducks, and people. Viruses tend to be fairly species-specific. A problem is if they can infect a species without making it sick, forming a reservoir of animals than can affect others without it being easy to spot the source (this is the problem with Ebola, although they’ve kind of narrowed that down to bats as the carriers). Pigs are a problem because they can be carriers of both avian and human viruses. Both get into the pigs, mix their genetic material a bit, and pop out as new viruses against which we have no immunity until we catch it and get sick. And the largest, densest, concentration of pigs, ducks, and humans is in central China.
- There is a strong suspicion that the current virus first infected humans at a “wet market”: one in which live animals are sold near meat for human consumption. They’re wet because ice is used, and waste often must be hosed away. Americans tend to take a dim view of this practice, but that’s mostly just prejudice: a restaurant like Red Lobster that carries live lobsters in tanks is a form of wet market too. It’s probably best to just note that these are more common in China.
- China has restricted travel for about 50 million people: essentially, a stay inside your home quarantine. This is largely because they don’t know what they’re dealing with, or how else to contain it. Again, keep in mind how Americans would be likely to behave if the government cut off all travel in, say, Illinois, Indiana, and Ohio. It wouldn’t go over well.
- A fear in China currently is that medical facilities inside that quarantine zone may not have enough supplies, In part, this is because these events are unfolding around the New Year’s holiday period in China: 10% of the population is engaged in long-distance travel to visit family and friends, and many businesses and vendors are closed or not making deliveries.
- There is general agreement that China’s response to this outbreak has been better than their response to SARS, but still not that great. Outside of China it is common to imagine that the central government in Beijing is all powerful, but the reality on the ground is often that it’s a distant overseer without much ability to manage local problems evenly or well.
- A fear is that this will turn out like SARS: not well. Even so, SARS only infected about 8,000 people with a 10% death rate. In the U.S., influenza alone kills roughly 100 times that many people each year. Having said that, initial projections were that SARS might kill 250 million people worldwide.
- Where did SARS go? No one knows. It probably mutated into something that isn’t harmful that we no longer notice. If you like science fiction, Michael Crichton’s first bestseller, The Andromeda Strain, was about an infection that did just that. (If you like movies, I prefer the 1971 version to the 2008 one).
- Beware of people who say this is like the 2011 movie Contagion, or the Steven King book The Stand. Could it be? Of course, anything is possible. Is it? Almost certainly not.
- Having said all that, do recall that the Spanish Flu epidemic of 1918-20 killed 3-5% of the population on the planet. And the latest research is that it too may have started in China. On the other hand, that is by far the deadliest flu outbreak in history, and has yet to be repeated.
Monday, January 27, 2020


There’s a new text from MIT Press targeted at Macro I in graduate programs.† These charts from Chapter 1 are a good addition to what we’ve been covering so far:


Do note that both of these are showing the log of real GDP per capita, rather than real GDP, as I have been doing in class. When trying to get a sense of the ups and downs, and the trend, this probably doesn’t make too much difference. Since the economy grows with some volatility, but population does not, these are probably tracking the log of real GDP fairly well. I am thinking that they look less smooth than the charts in Barro due merely to the fineness of the lines in this text.
† Alogoskoufis, G. S., Dynamic Macroeconomics, MIT Press, 2020.


Do note that both of these are showing the log of real GDP per capita, rather than real GDP, as I have been doing in class. When trying to get a sense of the ups and downs, and the trend, this probably doesn’t make too much difference. Since the economy grows with some volatility, but population does not, these are probably tracking the log of real GDP fairly well. I am thinking that they look less smooth than the charts in Barro due merely to the fineness of the lines in this text.
† Alogoskoufis, G. S., Dynamic Macroeconomics, MIT Press, 2020.
Test Post: Number in Absolute Poverty vs. Proportion in Absolute Poverty
I believe this will finally show as intended. I do not expect this to last. I fully blame short-sighted bureaucrats in the European Union, and their enforcers the large internet companies. If the images posted here disappear, or the post itself does, blame them, not Dr. Tufte. Everything I've done here has always been covered by the doctrine of fair use.
******************************
The World Bank defines poverty on an absolute scale.† Here’s some snapshots (sorry about the quality, it was tough to get these out of a protected format):

The above shows the improvement in number of people living in absolute poverty. Below is a repeat from what we looked at in class on Friday (so that we have them on the same page). It shows the proportion of people in absolute poverty.

And here is an image from another source that shows that the number of people in absolute poverty got worse for a while (as people lived longer and population went up), but that has been overcome by reducing the proportion in poverty over the last few decades.

This is a phenomenon taking place in most countries around the globe. But the numbers will be dominated by changes in China (bigger improvements over more people) and India (pretty good improvements over a lot of people, but not as pervasive as in China), due to their large populations.
† If you don’t know the difference between absolute and relative poverty, you should get this down cold (economists have to know this because there are lots of non-economists that don’t and could probably use our help).
Absolute poverty means you define a level of stuff or some real currency threshold that is fixed or constant. (Keep in mind that if you’re using a real currency threshold, that may change when you change base years). Anyway, if you exceed that threshold you’re no longer poor. The World Bank, since 1990, has been using a real currency threshold to assess absolute poverty globally. As of 2015, this was set to $1.90/day, or about $700/year in PPP real GDP per capita. I believe those PPP dollars are calculated using the Geary-Khamis method, using a base year of 2011 (that sentence isn’t stuff you have to know, but if you see those words now you do).
Relative poverty means you define a proportion of what most people have as the the threshold. For this, it doesn’t matter whether you choose a real or nominal value to start with. It may matter whether you choose a mean, median, or some percentile value to start with (because the income distribution isn’t a nicely behaved bell curve anywhere). For example, you might say that the poverty threshold is 50% of median income. In the U.S., the poverty threshold is set by the Census Bureau. The calculation is more finely grained than that, but that’s the basics.
The advantage of using absolute poverty as a measure is we know if people’s basic needs are likely to be met. The disadvantage is we don’t know how far poor people are away from typical people. The advantage of relative poverty is we know roughly how many people are disadvantaged relative to those around them. The disadvantage is that this is a sliding scale: as a country gets richer, the threshold for poverty goes up, and can be difficult to compare across regions and times.
More practically, absolute poverty can be eliminated, but it doesn’t mean that there won’t still be people who are worse off. Alternatively, one might be able to eliminate relative poverty, but since the threshold generally increases with the passage of time this almost never happens.
Subscribe to:
Posts (Atom)