Wednesday, April 15, 2020

A Very Guarded Quote (Updated a Little)

This happened today: protesters clogged the capital of Michigan (social distancing be damned) to protest ... social distancing.

I am not supporting or condoning this.

But the group's leader made a money quote:
Quarantine is when you restrict movement of sick people. Tyranny is when you restrict the movement of healthy people...
It is worth emphasizing that the world was surprised back in January when China locked down healthy people. This was surprising because [and I am certain that I mentioned this in class as well as in this post] quarantining is what you do with the infected people. What China did was not a quarantine.† There simply was no epidemiological evidence prior to that Chinese policy of any government ever trying that, much less having it be effective.

So, it is worth pointing out and remembering that we still don't know if this is a good idea or not, on net.

† They are called SEIQR models because the population progresses from left to right, and quarantine comes after infection.What comes before infection, susceptibility and exposure, includes nothing about social distancing or quarantining healthy people.

*************************************

My personal opinion is that social distancing and shutting down much of the economy is working, and I support it. So I'm angry at protesters like those in the linked article.

But I will also admit that I do not know or have evidence that social distancing will work, and my feelings on this could be wrong. Lots of policymakers around the world would benefit from realizing this.

Also, paying close attention to the countries (say Sweden) and states (say South Dakota) that are doing things differently is warranted. Recall from basic regression analysis that it is the observations that are not like all the others that have the most explanatory power.

I added the two highlights in green about 12 hours after initially posting this.

More Innumeracy

This is from Reuters, so it's available by clicking a link the world over. Here's a quote:
The United States recorded its first coronavirus fatality on Feb. 29. It took 38 days to reach 10,000 deaths and just nine more days to go from 10,000 fatalities to 30,000. The previous high single-day death toll was 2,364 on Tuesday.
It's true, but the presentation of the math is misleading.

First off, note that going 10K to 30K deaths is tripling in 9 days.

Secondly, how many times would you have to triple to get to 10K from one? Hmmm: 1, 3, 9, 27, 81, 243, 729, 2187, 6561 means that tripling 9 times would get you well past 10K.

Third, to triple 9 times in 38 days is tripling a little more than every 4 days.

Would you rather triple in 4 days or 9 days?

While all of these deaths are tragedies, and the ongoing pandemic is a horrible thing, what we have here is evidence of "flattening the curve" reported as things getting worse because " It took 38 days to reach 10,000 deaths and just nine more days to go from 10,000 fatalities to 30,000."[emphasis added]

COVID-19 # 53 (Required Parts Highlighted)

Interesting twitter storm from an emergency room doctor working in New York City. Not much urban mythology about the U.S. healthcare system in this one.

Here's some arithmetic to put things in perspective. New York City has a population of 8,000,000. Currently they have about over 100,000 positives, and over 10K deaths. So that's 1 out of 80 people has it, and out of those, 1 out of 10 will die. If you were on campus at SUU, 1 out of 80 is roughly 2 positives in the typical student's classes. And, between you and 4 friends, you'd know 10 positives, one of whom would have died already.And with an R nought of 3 and a serial period of a week, it would go from 1 out of 80, to 3, then 9, then 27, then 81 out of 80 within a month. Glad you're at home? And the amazing thing is — in New York City they're feeling a little better about their situation because they felt it could be worse.

New research suggests the intermediate animal that transmitted the virus from bats to humans in Wuhan may have been dogs. The presumption is that feral street dogs at bats or bat droppings, and the virus thrived in them.

Of course, you've probably heard by now that China is requiring scholars at universities to get their COVID-19 and SARS-CoV-2 research approved by the government before submission to academic journals. Last time I checked, peer review meant review by your peers.

Trump is going to defund the WHO. Not good (at this time). But lost in all of the news about this is the strong suspicion that another one of the WHO's large donors told them the same thing about 3 months ago.

Yesterday was Day 1 for Austria starting to allow small businesses to re-open. Stay tuned.

This is personal opinion, but did it seem like the story du jour in the legacy media changed on a dime this week? From New York City is getting worse, to plans to "re-open the economy".

For those of you not getting this, governors have become so important because of the 10th Amendment. It states that any powers not given specifically to the federal government belong to the state governments. And pandemic response was not exactly something that the federal government was planning for. Already, there are two groups of governors planning on working in tandem to "re-open".

Interesting news in China: there have been quite a few factory fires. No one is sure why (China's insurance system does not work the same way as ours, so owner-arson seems unlikely). Not much news coverage of it inside China either. This bears watching.

Fake news: at a press conference Iran's health minister showed an image of an Iranian nurses PPE related bruises. Internet sleuths determined it is a photo of a nurse from Brazil. Meanwhile, dissidents report Iran's death toll to be roughly the same as the U.S., and about 5 times higher than the official toll. That's consistent with the WHO report from a month ago that the number of cases was 5 times larger than the official numbers.

Monday, April 13, 2020

COVID-19 # 52 (Required Parts Highlighted)

The next problem for Americans is going to be rolling closures of "essential services". This week it's a Smithfield Farms production facility in South Dakota, that produces about 5% of the packaged pork products in the country. I seen this as potentially a big problem, but not one so far — what is essential is that places like this don't start to shut down simultaneously. BTW: the "pig farm" in Milford (about 45 minutes north and then northwest of Cedar City) is part of the supply chain for Smithfield Farms.

In China, there were provinces, especially to the north of Wuhan, where the first wave of COVID-19 had little impact. Suifenhe, in Heilongjiang, is not under a lockdown similar to that in Wuhan from 11 weeks ago. This includes building new hospitals. China is blaming this outbreak on travelers from Russia. There may be some truth in that, but it only takes a few seconds on the internet to confirm that most of the population in that area lives on the Chinese side of the border (and epidemics tend to go urban to rural).

The Epoch Times has obtained health department documents from Wuhan during the worst parts of the outbreak. I have stressed two big points about Chinese data this semester. The first is that it tends toward falsehood; not outright lies, but consistent shifts in one direction. Students in past semester seem to get a good handle on that, but they're less good on the second point. This is, that China's data problems start at lower levels of government, are compounded as they go up, and are not typically a national policy coming from Beijing. These new numbers fit that pattern. 

  • On January 12th, during the 2 week period when authorities in Wuhan were claiming that cases has plateaued at 41, data showed that 200 people went to the hospital for a fever in just of one of Wuhan's thirteen districts (of course, fever is not something one usually goes to the hospital for). 
  • It is not known exactly how many hospitals there are in Wuhan, but 200 is a rough guess. On January 29th, 26 of them were designated for COVID-19 patients only. However, at the same time, hospitals were told they could not report COVID-19 cases unless they were one of those designated hospitals. The city reported 356 admissions to those hospitals that day, while one of the 13 districts reported 150 hospitalizations for COVID-19 outside of those hospitals. This is suggestive of an outbreak 5 times the reported size. That's consistent with the crematoria data which showed an outbreak 12-13 times the reported size. Also, growth rates of 64% were in the official data as recently as 2 days before this move; growth rates dropped steadily after that.
  • On February 11th, the columns on the data reporting forms for COVID-19 used by local hospitals were deleted, and did not appear again. That date corresponds to a discrete drop in official daily growth rates of cases by over 20%, followed by continued smooth declines.
  • A listing of names of confirmed COVID-19 deaths from March 14th shows that 71% were outside the 26 designated COVID-19 hospitals, and an additional 26% did not have a hospital designated. Only 3% of the reported COVID-19 deaths were from a COVID-19 designated hospital.
  • Lastly, a report from a residential compound for hospital employees in Hubei indicated that a third of them were infected.

Again, I'll emphasize that The Epoch Times is not friendly to the government in Beijing, so they are definitely looking for dirt. Having said that, they usually find it, and it tends to be quietly confirmed in our legacy media within a few days.

Sunday, April 12, 2020

COVID-19 # 51 (Required Parts Highlighted)

We made the national news, or at least Washington (near St. George) did. And not in a good way (although I was ticked that the made zero mention of the fact that Utahns have a headstart on being prepared for this sort of thing). Anyway, I was down there on Thursday evening actually. I did see quite a few businesses closed, but it was busier than I expected. Also, those big digital signs they post warnings on over the interstates were turned off; to me that seems like an obvious place to note that travel is discouraged, or say how the number of COVID-19 fatalities compares to the highway fatalities they're always advertisign. BTW: cases and hospitalizations in the southwest Utah region were up again today.

Caixin, a publication that does work openly in China, but which is also openly critical of the government, reported today that the government in Beijing was not informed of human-to-human transmission until January 19th (2 days before the decision to quarantine Wuhan was made).

I have seen several versions of this information in the legacy media, and every single one of them has been wrong (they show just one graph, so it's basically just noting that pollution tracks urban areas on a random day). So I went to the source. You need to compare the two images. This is before:
This is after:
What's being shown here is nitrogen dioxide concentrations. These are primarily generated by diesel vehicles and coal burning power plants (not usually located in cities). It is somewhat weather dependent as well (this explains the absence of Columbus, Rochester, and Syracuse in the before picture, and huge fadeout of Boston in the after one). We got chloropleths of this from China about a month ago. Anyway, viewed properly, pollution is way down, especially in NYC. FWIW: I've noticed basic thinking ability seems to go down anytime pollution measures are involved.

Excellent piece in The Wall Street Journal entitled "Why Doesn't the Flu Tank the Economy Like COVID-19?"

Instead of gentle waves of cases cascading across the country over a span of six months, like the flu, a tidal wave of Covid-19 cases has swept over a handful of cities in half the time. The concentration of quickly amassing serious infections overwhelmed the affected areas ...
We had a flu pandemic about 10 years ago, and here's the comparison:
In 22 fewer days, Covid-19 infected 11 times as many people and killed 60 times as many. 
That pandemic was far worse than a typical flu season. Even so, while a lot more people get the flu, amongst those that do, you're 8 times more likely to be hospitalized if you get SARS-CoV-2, and your stay will be almost 4 times as long. It is mathematically valid to multiply those and imply that hospital usage will be 30 times higher during COVID-19.

It took me over a day to find a day-by-day total for Utah (yeah Bing, boo Google). Go to the top item on this link, and then click Trending Stats, and mouseover the graph. Anyway, yesterday, my top chart was about doubling rates after a location hits 10 deaths. Utah doesn't qualify for fleshing out that graph just yet, but the daily death total just doubled in 7 days (from 8 to 17), which make us comparable to Washington (state). FWIW, I also did an exhaustive examination of our doubling times for all new deaths (e.g, when we hit 2 how long did it take to get to 4, and so on), and the day were 1, 3, 5, 6, 10, and 7. Together, those suggest that our experience in this state is not much better than what other states have experienced; but we clearly started later, so we'll peak later.

Prime Minister Boris Johnson was discharged today after 8 days and 7 nights in the hospital. He will not be returning to work or even his primary residence right away. As is probably normal with things involving leaders, it turns out that the truth was worse than we were led to believe. Apparently they had been notified he might need hospitalization 3 days prior to ultimate check-in, and his condition  in the hospital deteriorated more deeply and rapidly than people were led to believe.

There are confirmed reports this morning of hospital overload hitting Moscow.

Friday, April 10, 2020

COVID-19 # 50 (Required Parts Highlighted)

As long as you don't use this sort of chart the wrong way (to make a forecast by presuming that each location behaves the same way), it can still be used in interesting ways:
This gives a sense that small improvements in "flattening the curve" can lead to big declines in deaths. And, I just checked the data: Utah just recently had its 10th death, so if we were to go on this graph it would be way down at the left.

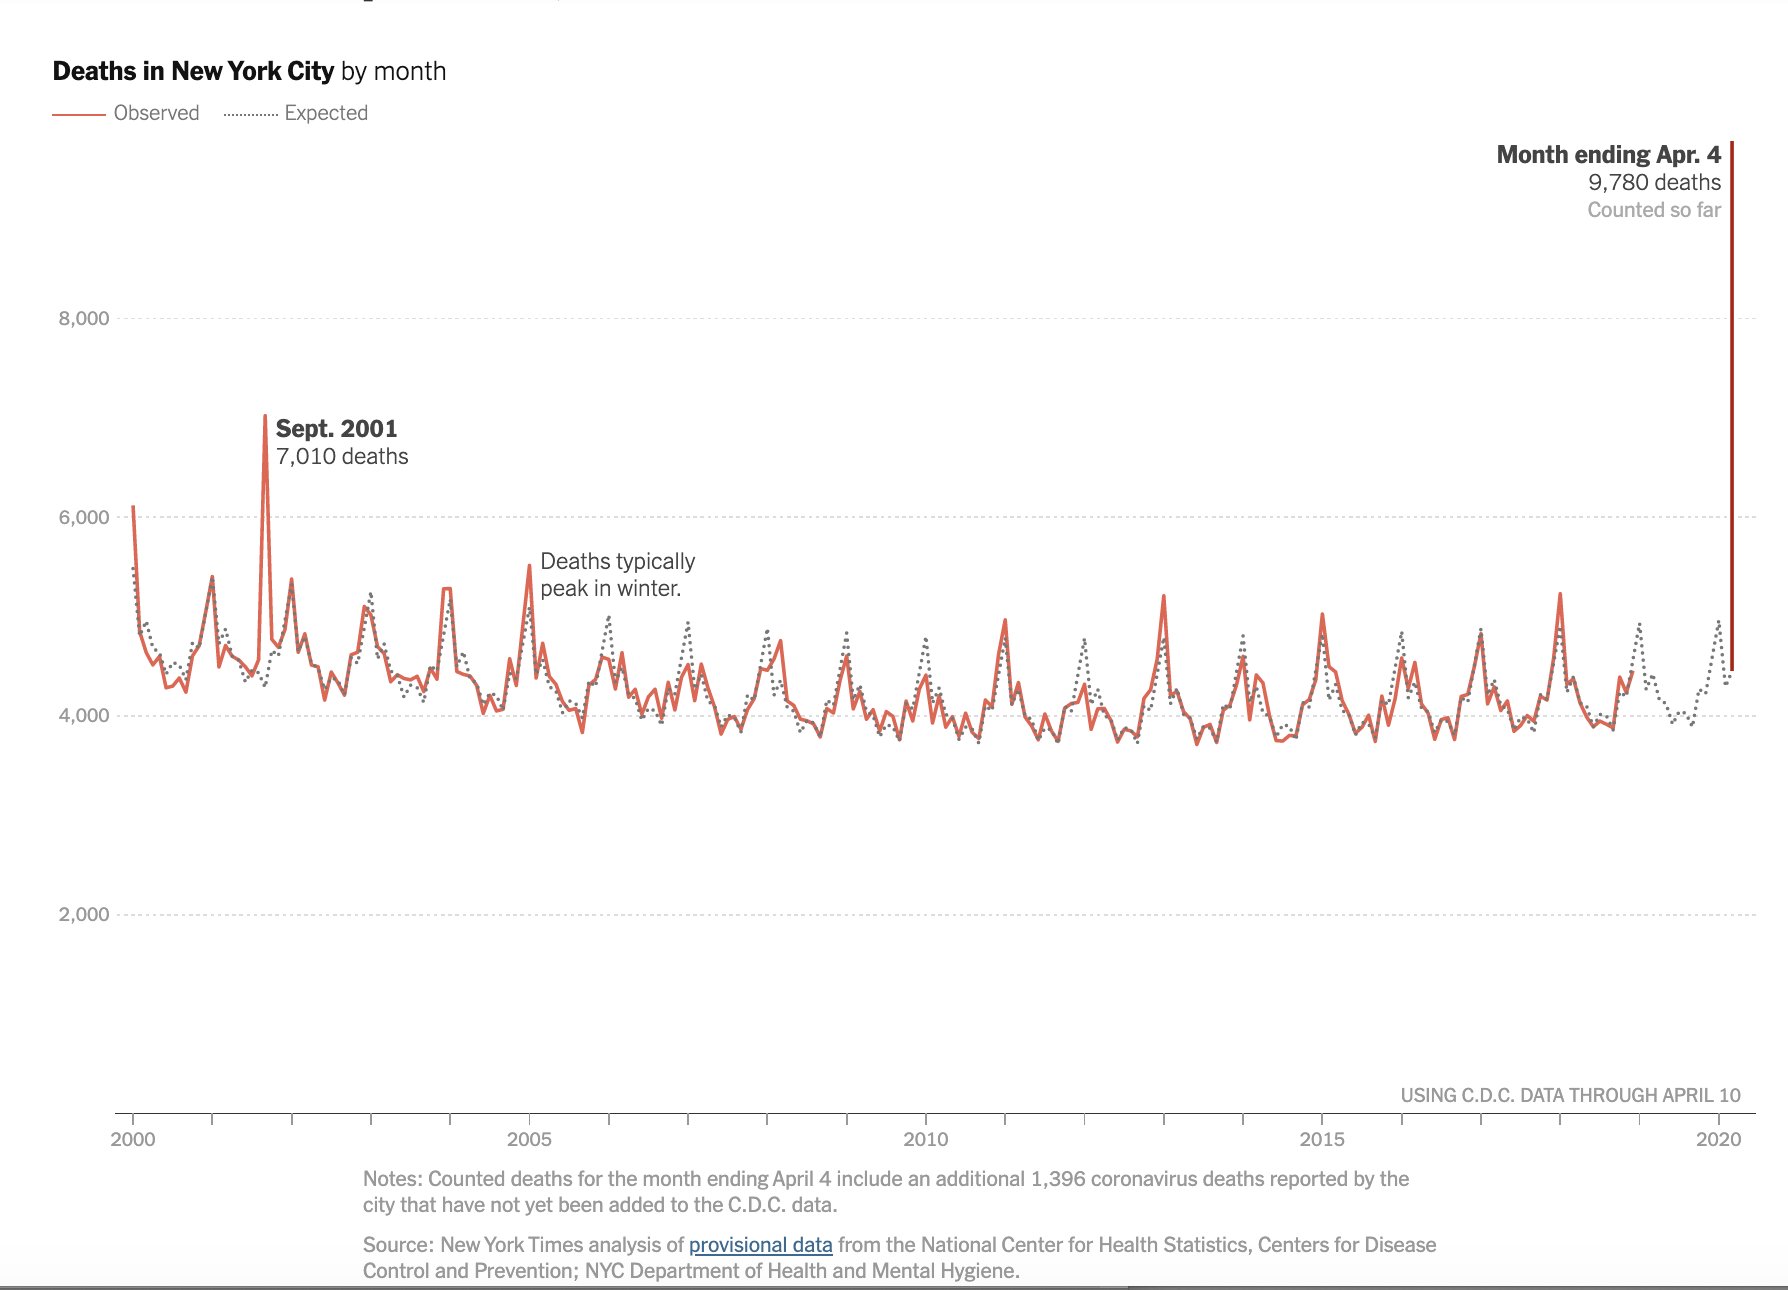
Here's a time series graph to help you digest what is going on in New York City:
All of those peaks every winter are the flu. Any thoughts on whether this is just like the flu? Oh ... and sharper photos of those trench graves in New York City show the coffins are stacked three high.

That cool chart that TL brought to me from Flouish has been updated. I could not get it to repost properly, so you'll just have to click through, but COVID-19 has now moved up to be the #1 cause of death in the U.S. The other day it was # 3.

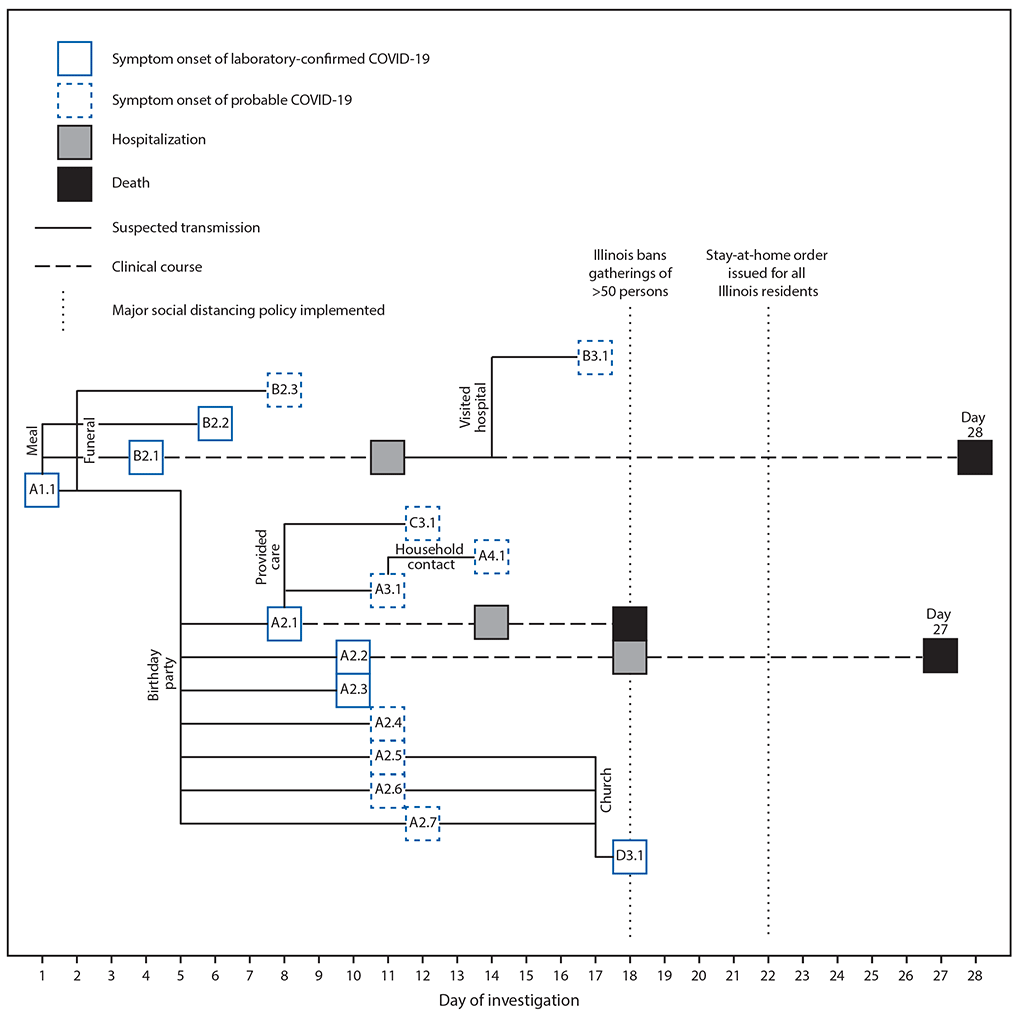
Contact tracing is how South Korea did so well. In it, you figure out everyone a person came in contact with, and you find them and get them quarantined. Here's what happens when you don't:
This is from Chicago. In South Korea they got cellphone data showing where positives had been, and reached out to every other person with a phone who'd been to that place.

New research from the CDC estimates that the R0 of SARS-CoV-2 is much higher than previously thought. Their 95% confidence interval for R0 is 3.8 to 8.9.

Remember federalism? Ian Bremmer makes an excellent point:
This is the flip side of some governors (like Herbert in Utah) not shutting down their states. Do note that Utah is now requiring travelers from outside the state to divulge their travel plans once arriving in our state.


Numbers continue to go up in our region: 52 positives in southwestern Utah and 4 people in the hospital. The much smaller Central Utah Public Health Department (which is likely to send some cases to the hospital in Cedar City) now has a COVID-19 page up and running. They are up to 6 cases and 1 hospitalization. The worst hit is Millard County, which is in the area that probably will send people to Cedar City.

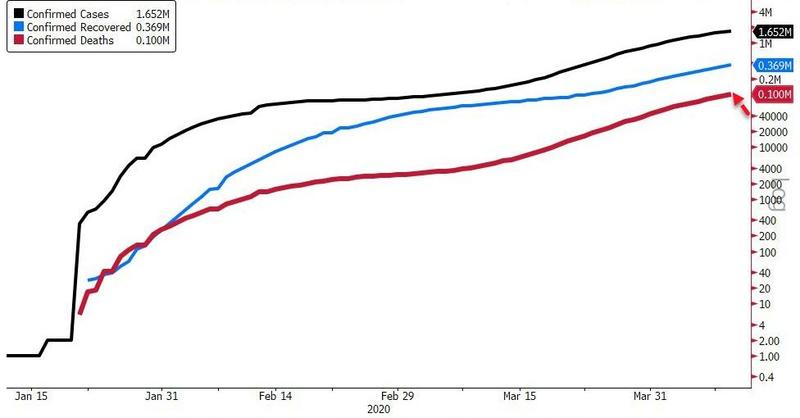
And here's an example of how not to use a log scale.
The math here is correct but the perception it created is incorrect. This invites comparison of the black, blue, and red curves, and the eye is drawn to the distance between them. But, because of the log scale, that distance doesn't mean the same amount on the right and left of the chart.

Some New Visualizations

Here's a couple of new visualizations from Statnews. The yellow circle is current numbers, the larger browner circle is projected numbers:
I dislike these seasonal flu comparisons. Flu is something we do nothing about, and this is what we get. COVID-19 is something we're doing unprecedented things to combat, and that only gets us down in the range of flu. In a month.
Not too fond of this one either. None of these are infectious, communicable, diseases. But, I think it's useful because as a nation we're pretty freaked out about suicides, overdoses, and Alzheimer's.