Current student AH sent along a link to this article from The Economist. It’s a pretty cool dynamic infographic that allows you to see lists of countries ranked by various measures of macroeconomic performance. Fun to play with …
Friday, January 24, 2020

Wednesday, January 22, 2020
Cute Graphic
I liked this:

This came from the article entitled “Receding Risks, Stronger Growth” that appeared in the January 20th issue of The Wall Street Journal. The article is not required.
Wednesday, January 15, 2020
New Research Appropriate for Class This Week
Most of the time, the new research discussed in this blog is not timed to match what we’re doing in class. I got lucky this time.
Also, while there is a paper behind this post, I’ve been unable to find a free copy of it. So I’m going mostly on the basis of the discussion of this in this Marginal Revolution post.
******************************************************
In class we’ve been talking about geographic correlation. This is the fact that we all live near each other to improve our level of well-being, and it seems to work.
I’m not a big fan of cities, but the message there is that urbanization is telling us something really important. I emphasized in class that countries collect data, and tell us how important they are, but the critical macroeconomic action seems like it might be at a lower level.
In contrast, we have a problem in the U.S. and in many other countries: people in cities know they have a good thing going, and don’t want any more people moving into their city and ruining it. The acronym often used for this is NIMBY: short for Not In My Back Yard. In the U.S. NIMBY-ism often takes the form of real estate zoning, which restricts the density of new construction, and the uses to which it can be put. For example, it’s very difficult to build a new home in coastal California due to zoning restrictions, and this places constant upward pressure on the prices of existing homes in that region.
In this new research, they build a theoretical model, and use it to explore counterfactuals. That’s a good college level word: it means they look at “what if” scenarios.† In particular, they look at what would happen if people could just move to, say, New York City, without current residents of New York putting up legal/cultural/social/political barriers to keep newcomers out.
Here’s how Tyler Cowen summarizes some of this:
1. If you restricted New York City and Los Angeles to the size of Chicago, 18.9 million people would be displaced and per capita rural income would fall by 3.6%, due to diminishing returns to labor in less heavily populated areas.
2. The average reduction in real income per person, from this thought experiment, would be 3.4%. You will note that NIMBY policies are in fact running a version of this policy, albeit at different margins and with a different default status quo point.
3. If you were to force America’s 11 largest cities to be no larger than Miami, real income per American would fall by 7.9%.
4. If planning regulations were lifted entirely, NYC would reach about 40 million people, Philadelphia 38 million (that’s a lot of objectionable sports fans!), and Boston just shy of 30 million (ditto).
5. Output per person, under that scenario, would rise in NYC by 5.7% and by 13.3% in Boston. That said, under this same scenario incumbent New Yorkers would see net real consumption losses of 13%, whereas for Boston the incumbent losses are only about 1.1%.
6. The big winners are the new entrants. On average, real income would rise by 25.7%.
7. Alternatively, in their model, rather than laissez-faire, if America’s three most productive cities relaxed their planning regulations to the same level as the median U.S. city, real per capita income would rise by about 8.2%.
[emphasis is mine, not original]
As a closer, let me note that this problem is worse in most other countries (what makes America so rich is the large number of pretty big cities, not the few huge ones). For example, consider Seoul, where the population of the metropolitan area is half of the whole country … how many of you can even name another South Korean city.
† As students advance to higher levels, where modeling is pushed out to them more often, the common complaint is — Why do we have to do all this math? The answer is to make better counterfactuals.
Sunday, January 12, 2020
Thinking Like an Economist: Income and Wealth Inequality Edition
It’s a given that a lot of people are concerned about inequality. Income inequality has historically been a more popular topic, but wealth inequality is also big this political season.
Let’s leave aside whether inequality is harmful or not, or has its positives too.
Instead, let’s focus on something completely different: are there 2 things to be worried about here, or something less than that? This is a perspective you won’t hear from anyone who isn’t an economist, and you won’t hear it from most of them either.
The trick to seeing this is to use finance to think in terms of present value. A stream of income going into the future has a present value today. Alternatively, a pile of wealth today can be turned into a stream of income of any length going into the future.
Going a bit further, it’s not that unusual to have young people with high income but not much wealth, and old people with low income but a lot of wealth. It’s not a big stretch to notice that we could come up with 2 different looking financial situations with the same present value. While we might prefer one or the other personally, on average those are interchangeable.
**************************************************
So here’s the thing. Does, say, Bill Gates high wealth also earn him a high income? Of course it does. But, if we have some list from highest to lowest wealth, and another list from highest to lowest income, and we’re worried about the inequality in those lists … Bill Gates shows up on both even though he’s not working for income in a conventional sense.
It’s not as obvious going the other way, but are there young people with expectations of a lifetime of high income who buy a house (a form of wealth) that their older, lower income, siblings can’t? (I’ll let you in on a secret: that describes both sides of our family fairly well, but it doesn’t feel that great when we’re the ones making the bigger mortgage payments).
My point is not that income inequality isn’t important to understand, or that wealth inequality isn’t important to understand, but that there’s not really 2 distinct problems here, and economists ought to be telling people this.
Friday, January 10, 2020
Taxing Wealth
A lot of Democratic presidential candidates are in favor of a wealth tax.
This sounds better than it can ever be. Why is that so?
First off, while Congress can definitely pass such a thing, but it would very likely be ruled unconstitutional. In fact, it would probably require passage of a new Amendment to the Constitution.
How can that be? It’s because the Constitution doesn’t permit direct taxes (direct are those directed at an entity). Income was not initially taxable, and it required the 16th Amendment to make an exemption for income so that it could be directly taxed. An exemption for wealth would require an amendment too.
Do note that direct taxes are permissible on real property.† But much wealth, and the part that seems to bug many progressives, is financial property. So the Democrats are scoring political points by proposing to tax something that isn’t yet taxable. Uh oh. Also note that most real estate taxes, and personal property taxes (on stuff like cars) are levied at the state and local level. It probably would be hard to introduce a new and additional federal layer of tax on to those things.‡
Now, you may say that there are inheritance taxes on wealth, and this is true. But those are levied on the transfer of wealth. And taxes on transfers of stuff (called excise taxes) are permitted by the Constitution at the federal level. So any wealth tax done this way would be … occasional for any particular asset, rather than a regular income stream for Congress to spend.
In sum, we have presidential candidates proposing policies that they aren’t capable of enacting. That’s not unusual, just significantly harder if an Amendment is required.
Secondly, there’s an issue with counting and valuing wealth. The value of anything is unknown until it is actually bought and sold. This makes the value of Big Mac’s easy to observe, but the value of, say, fine art much harder to observe. This is why homes are taxed based on “assessed value”, rather than (actual) value. Assessed value is set below an estimate of value to reduce complaints, and is often reset to the sale price when a sale happens (because that’s the time when value is established most firmly).
Now, wealth is composed of a wide variety of assets of value, but where would you draw the cutoff of which ones to value (and tax)? Stocks? Common, or preferred, or both? Equity? Net worth at book value or marked to market? What about options? Warrants? Derivatives? How about bonds? Registered or bearer? If the latter, that means you could tax cash in peoples’ pockets too (can you imagine)? Convertible debt? How about goodwill? How about brand equity (if we didn’t tax brand equity, could Coca-Cola Inc. avoid a lot of wealth taxation that a weaker brand’s owner — like Dr Pepper Snapple Group’s RC cola — could not)?
There’s nothing in this point that’s impossible to work through. But no one should have illusions that a wealth tax will be as simple as an income tax … and no one thinks those are easy.
† The usage of the word “real” here is as in “real estate”, and is not the same as its usage as an adjective indicating corrected for inflation, as in real GDP.
‡ I generally have some international students who don’t understand the American system of government very well, and some American students who could understand it better. In a federal system, like the U.S., the top layer of government is weaker, and the second level is stronger. The word federal is related to the word federation. In the U.S. this means the states often have more latitude to do things differently from one another than they may in other countries. In this case of this post, states can institute wealth taxes if it’s consistent with their state constitution. The federal government in Washington is a different entity, and its governing document doesn’t permit direct taxes on wealth that isn’t real.
Thursday, January 9, 2020
An Interactive Chart of Per Capita Real GDP Growth
Here’s what’s happen to real GDP over the last 2/3 of a century:
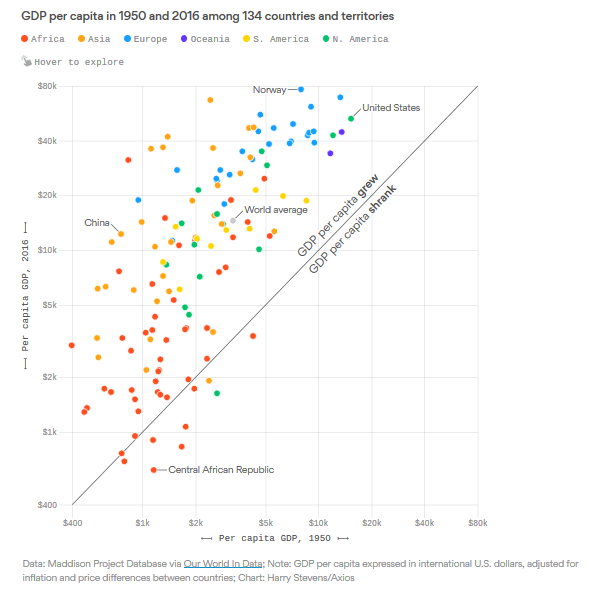
Do note that this chart was produced by serious people/economists, not journalists or graphic artists. So, you should note immediately that the axes are on a log scale (note that the base of those logs shifts between 2.0 or 2.5, rather than some constant value like e, this is an odd thing to do, but it's done correctly here.).
Going to the right is richer in 1950. Going up is richer in 2016. Hugely successful (mostly East Asian) countries are towards the top left.
An important takeaway is that China is doing very well to be at the top left, but it is not unusually successful … a lot of other countries have done the same thing.
Growth models, starting with Solow’s, suggest (as one of their most basic implications) that growth rates should be higher when a region is poorer. On here, growth is upward slope, so the arc from the lower left corner to the upper right corner is consistent with theory.
This is a screen capture of an interactive chart. Go to the source to see the actual countries, and the multiplier for improvement (for example, the average person in the U.S. is 3.5 times better in 2016 than in 1950).
P.S. One more thought: if you're trying to assess whether one country has gotten relatively richer or poorer than another, the trick is to use a 45 degree line, but one which passes through the dot of one of the country's: if the other country is above that line it got relatively richer, below it got relatively poorer. For example, China got relatively richer compared to the U.S., but held its relatively status compared to Norway. And, if we're going to do this, then it make sense to note that the original 45 degree line in the chart is showing which countries got absolutely richer, or absolutely poorer.
Note to self: something in this image would crash the uploading of this post. It had to be copied and pasted into Blogger.com before it would upload. That's why the paragraph spacing is weird and the image hangs over into the sidebar.

Do note that this chart was produced by serious people/economists, not journalists or graphic artists. So, you should note immediately that the axes are on a log scale (note that the base of those logs shifts between 2.0 or 2.5, rather than some constant value like e, this is an odd thing to do, but it's done correctly here.).
Going to the right is richer in 1950. Going up is richer in 2016. Hugely successful (mostly East Asian) countries are towards the top left.
An important takeaway is that China is doing very well to be at the top left, but it is not unusually successful … a lot of other countries have done the same thing.
Growth models, starting with Solow’s, suggest (as one of their most basic implications) that growth rates should be higher when a region is poorer. On here, growth is upward slope, so the arc from the lower left corner to the upper right corner is consistent with theory.
This is a screen capture of an interactive chart. Go to the source to see the actual countries, and the multiplier for improvement (for example, the average person in the U.S. is 3.5 times better in 2016 than in 1950).
P.S. One more thought: if you're trying to assess whether one country has gotten relatively richer or poorer than another, the trick is to use a 45 degree line, but one which passes through the dot of one of the country's: if the other country is above that line it got relatively richer, below it got relatively poorer. For example, China got relatively richer compared to the U.S., but held its relatively status compared to Norway. And, if we're going to do this, then it make sense to note that the original 45 degree line in the chart is showing which countries got absolutely richer, or absolutely poorer.
Note to self: something in this image would crash the uploading of this post. It had to be copied and pasted into Blogger.com before it would upload. That's why the paragraph spacing is weird and the image hangs over into the sidebar.
Wednesday, December 18, 2019
Subscribe to:
Posts (Atom)