Wednesday, April 5, 2023

Half of a Story About China

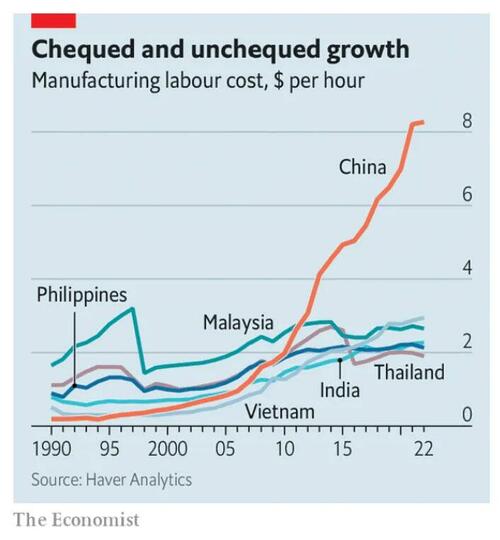
The Chinese are getting richer. You can see that in this chart from The Economist:

The Chinese getting richer is a good thing that we should all be happy about. But this is not the same thing as China getting bigger or (economically) stronger.

Charts like this are very common. But an economics student ought to recognize a problem immediately: for a firm, that orange line is a cost. The firm only benefits if productivity has gone up just as fast. 

The source provided no information on this. The message for a student then is to stop, stall, and look for other information. Do not "jump at the bait" of looking at only one side of the issue.

BTW: Yeah, I spent many seconds looking for that information myself. The article in The Economist didn't have it (so they were doing the same dumb thing I just warned you about). And I could not find it at Haver Analytics either; but that doesn't mean that much since they are a consulting service academics and student can't afford to pay for, and they keep most stuff under lock and key.

Thursday, February 23, 2023

GDP Revision for 2022 IV

Revisions to GDP numbers are normal. Today's just happens to coincide well with what we're doing in lecture.

The rough draft of these numbers came out a month ago, and this is the revision. Here's the press release.

You have to scroll down a bit, but nominal GDP growth was revised upwards from 6.5%/yr to 6.7%/yr annualized. There you'll also see that the "price index for gross domestic purchases" rose from 3.2%/yr instead of 3.6%/yr. This is all from the BEA, so the price index is annualized too, unlike the CPI.

Now, going back to the top, real GDP growth was revised downwards from 2.9%/yr to 2.7%/yr annualized.

But if you look closely, the numbers don't match up. Working through this is a good exercise. 

The way that you combine the price and real GDP information to get the nominal GDP information has to check. The arithmetic is that you take the product of the gross rates and subtract one, as in: 

(1+.032)(1+.029) - 1 = .062 (for the advance estimates)

(1+.036)(1+.027) - 1 = .064 (for the second estimates)

Neither of those check.

What's going on here is a combination of two things. First off, the data from the announcement is not the right one to use. Go figure. Secondly, annualization makes a difference.

To get the right data, you need to dig a bit. Go from the BEA.gov home page, click "Data", then "By Topic", then Gross Domestic Product. Click "Tables Only" towards the bottom of the page (an Excel file will download). Nominal GDP is in the top middle of Table 3. Real GDP is towards the top right.

Nominal GDP (in billions of dollars per year) went from 25,723.7 to 26,145.0. Divide the latter by the former to get the gross rate of NDGP growth: 1.01637%/qtr. To annualize, raise that to the 4th power and get 1.0671. Subtract 1 to get the net rate, and express as the rate 6.71%/yr. Check.

You can do the same thing for real GDP (in billions of 2012 dollars). It went from 20,054.7 to 20,187.5. The gross rate is 1.00662, the annualized gross rate is 2.68%/yr. Check.

But where does the 3.9%/yr inflation rate come from that balances those two? Above, I noted there are 2 issues, but let's do the annualization first. Generally, the gross rates of real GDP growth and price growth have to be multiplied (sort of like compounding). BUT,  you need to do this with the original quarterly data, and then annualize that, rather than do it from the already annualized rates. So, the 1.00662%/qtr for real GDP has to be multiplied by an unknown (1+x)%/qtr, to get 1.01637%/qtr. Just divide those two to get 1.00968. Compound that to get 1.0393%/yr. Subtract 1 to get 3.9%/yr. Check.

Now back to the first question: where's the index that actually went up by 3.9%/yr? This requires more digging. It's called the implicit price deflator, Put that into the search bar at the top of the BEA home page. Look for a link titled "What Is an Implicit Price Deflator and Where Can I Find the GDP IPD?" In there you'll find a link to Table 1.1.9, with the data you want at the top right.

The index went up from 128.269 to 129.511 (you could think of that as the dollar prices now of stuff that cost $100 in 2012). That's a gross rate of 1.00968%/qtr. Compound that to get 1.0393%/yr, and from that the net rate of 3.9%/yr. Check. 

Don't ask me why they don't put that one in the news release. A cynical person would say it's because they had something that sounded similar (the price index for gross domestic purchases) with a smaller/better number.

A casual way of thinking about this is that while your paycheck may have gone up last quarter, over half of that was needed to cover price increases.

***

In all of this, note that I don't have the advance estimate of the implicit price deflator. Couldn't find it. It is possible to find historical advance estimates, but it's not easy, and it wasn't worth more than a minute or two of trying.

But I can figure it out. Going back to the gross rates from the advance estimate — 1.065%/yr for NGDP and 1.029%/yr for real GDP, I can divide the former by the latter to get 1.035%/yr. 

So the revision said the NGDP growth rate went up by 0.2%/yr, and the RGDP growth rate went down by 0.2%/yr, and the difference (subject to rounding and compounding) is the 0.4%/yr increase in the implicit price deflator. In short, they initially underestimated inflation, and that made real GDP growth look higher than it really was.
Wednesday, February 15, 2023

French Social Security Trivia

Other countries face the same problems with their pay-as-you-go, cash-in-cash-out, social security systems that the U.S. does. 

In France that has led to riots of up to a million people. Keep in mind that the population of France is less than a fifth that of the U.S., so that dwarfs anything that's happened here. Ever.

The motivation was the proposed policy to raise the retirement age from 62 to 64. 

I learned a few things about this over the last few weeks. 

First, that's a mandatory retirement age for most jobs. Mandatory retirement was largely eliminated in the U.S. during the 1980s. No source for this that I can recall; something on NPR I think.

Second, I may have mentioned that other countries had these systems before the U.S. had them (at the Federal level). In France, the system dates to 1910, when the life expectancy was 51. Now it's 82.


Monday, February 13, 2023

Environmental Disaster in Ohio (Not Required)

Natural and environmental disasters have macroeconomic consequences. It's important to keep abreast of the news on them.

Americans have been distracted by balloon shoot downs the last 10 days or so.

Which has kept most people from knowing much about the ongoing environmental disaster in Ohio. This is looking like it may be the worst on in several years for the U.S.

The short version is that a train derailed carrying chemicals that were both hazardous to health and explosive. Due to fear of explosion, authorities started burning the stuff. Evacuations were ordered. Obstinate people wouldn't leave. Animals left out in the open have been dying. It's a mess.

***

This is not required because in the long-run, maybe this turns out to be nothing to worry about. But, there's a broader point that we worry about a lot of things that aren't that important, and then use those as cover to avoid thinking about the more serious stuff.

Turkey Earthquake Update 2

It's arguable that I was premature in noting that Turkey would fare better in their recent earthquake than poorer countries might.

To some extent, given the continuing rise in the death count, my two earlier posts may seem callous.

Having said that, it's well established in economics that death tolls drop as real GDP per capita rises. The seminal paper in this literature is Kahn's 2005 paper in the Review of Economics and Statistics (if interested, an ungated working paper can be downloaded here).

Kahn looked at 57 countries over a 13 year span, totally over 4K disasters and over 800K deaths. His Figure 1 and Table 8 summarize the results that deaths are inversely related to GDP per capita, and that disasters are not more likely in poor areas. They're just not dealt with as well.

(Interestingly, his summary in Table 3 shows that Turkey is one of the worst countries for casualties from earthquakes).

Thursday, February 9, 2023

Turkey Earthquake Update

The earthquake in Turkey now seems considerably worse than it did on Monday. I have heard reports that some are calling it the worst quake in the region in 2,000 years.

The pattern I outlined the other day continues to hold. Excepting the 2004 earthquake caused tsunami, all the countries above Turkey on the list of deadliest quakes are poorer than Turkey. And right behind in the casualty list is richer Japan which suffered from a bigger quake.

***

There are also very sketchy reports of high casualties over the border in Syria.

The problem with this is that we may never get a solid death toll from Syria. Syria on a map is not the same thing as what is controlled by the Syrian government, since rebel groups hold large parts of the country.Neither one is likely to have the organizational ability to accurately count deaths.

Monday, February 6, 2023

Turkey Earthquake

Forgive the morbidity of all of this. My point is that economic growth saves lives.

We discussed in class the morning's news of a large earthquake in Turkey. As of 8 pm, deaths are up to 4,300 from a quake that was a 7.8 on the Richter scale.†

I pointed out that this is a better performance than other, poorer, countries in similar situations.

On NPR on the way home, they pointed out that Turkey had suffered a 7.6 in 1999 that resulted in 17K deaths, and then I found a 7.8 in Turkey in 1939 that resulted in 32K.

† The Richter scale is logarithmic with base 10. So an increase in 1 point on the scale is 10 times stronger. To compare two quakes with decimals, raise 10 to the higher Richter value, and divide by 10 raised to the lower Richter value (use Excel or a calculator, unless you want to do the binomial expansion by hand). For example, today's 7.8 quake is about 60% more powerful than the 1999 quake which was a 7.6. That doesn't necessarily imply 60% more damage, but it does suggest they're not as comparable as they look.

N.B. Keeping in mind that valid comparisons require really close Richter values, there's a similar pattern that in other countries (like India, Iran, Italy, and Haiti) that the passage of time and  economic growth, lead to fewer casualties. Also note that countries with governments generally viewed by developed nations as suspect (China from 1950 to 1980, Iran since 1980) generally have higher casualties too.